Technical | Fundamental Analysis Discussion Stocks Listed In Bursa

Saturday, January 31, 2009

Investors avoiding banking stocks

By LEONG HUNG YEE


A FURTHER decline in loan applications and approvals has turned investors away from banking stocks.

As at 4pm yesterday, the finance index on Bursa Malaysia had fallen more than 36 points but managed to bounce back to close 2.01 points higher at 6,912.13.

In early trade, most banking stocks fell at least 0.5% with Bumiputra-Commerce Holdings Bhd leading the loss. The counter fell more than 2.4% to RM6.15 in the morning but ended 10 sen higher at RM6.40. Public Bank Bhd gained 5 sen to RM8.80, Alliance Financial Group Bhd put on 3 sen to RM1.89 while EON Capital Bhd added 2 sen to RM3.46.

Among the losers were Malayan Banking Bhd and Hong Leong Bank Bhd, both down 5 sen to RM5.25 and RM5.10 respectively. RHB Capital Bhd shed 4 sen to RM3.68 while AMMB Holdings Bhd slipped 3 sen to RM2.29.

An analyst from a foreign brokerage says the selling on banking stocks yesterday is just a knee-jerk reaction.

“The local banks are still resilient and we expect them to weather the current economic turmoil. It (the fall in banking stocks) was just an automatic response by investors after Bank Negara released the latest data on Thursday,” he says.

The analyst says as loan growth is one of the components contributing to a bank’s bottomline in the future, investors will be sensitive to monetary and financial developments.

Although loan applications and approvals continued to slide, loan disbursements to both the business and household sectors in December grew by 12.8%.

RAM Holdings Bhd chief economist Dr Yeah Kim Leng says the higher loan disbursement means more money is getting into the hands of individuals and corporate borrowers, which in turn will translate into higher spending.

“The other implication we can draw from the increased lending in December is that banks are heeding calls from the Government and the public not to turn off the credit flows in the face of a worsening global recession,” he said.

Yeah says the December disbursements likely comprised loan applications processed prior to the month.

“We expect bankers to turn more cautious in the coming months given the uncertainty over the severity and length of the global downturn at this point in time.

“Given that most countries, including Malaysia are rolling out sizeable fiscal and monetary stimulus packages to help boost confidence among banks and businesses, a depression is unlikely in these countries,” he says.

To a question, Yeah says stimulating domestic demand is the key to offsetting the sharp export downturn caused by the recession in the advanced economies.

“Lower interest rate encourages more borrowing and spending while declining inflation rate raises real disposable income or purchasing power. As long as the overall spending by government, consumers and businesses is not cut back drastically, the Malaysian economy will be able to withstand the global recessionary forces,” he adds.

On the external front, the analyst says there were positive signs.
If you like the post, please subscribe to Bursa Chat. We will send you the latest post by Email
===> Click
Subscribe to Bursa Chat by Email


BACK TO CHAT BOX

Thursday, January 29, 2009

By Zhuge Liang
综合指数 2009年 01月 28日

如图中箭头A所示,综合指数稍微上扬6.94点,惟还是处于布林中频带(Bollinger Middle Band)以下,综指当前的阻力水平依然落在887点的胜图自动费氏线,支持水平则是处于869点及853点的胜图自动费氏线。

如图所示,布林频带(Bollinger Band)收窄5%,这表示综指继续出现调整巩固的格局,这意味综指正在从之前的跌势中恢复过来,这也可以说是技术反弹,因为综指毕竟仍然是处于布林中频带这动态阻力线以下。换句话说,综指是必须先上扬突破了布林中频带,那综指才有望从纯技术反弹转为短期上扬的趋势。

如图中箭头B所示,成交量在漫长的假期后进一步的萎缩23.1%,使到成交量继续的处于40天成交量移动平均线以下。通常在成交量低迷的情形下,综指是倾向于出现调整或横摆巩固的格局。

平均乖离的振荡指标(MACD Histogram)开始上扬,这意味着振荡指标有开始形成一个圆底(Rounding Bottom)的迹象(参开箭头C)。换句话说,若振荡指标继续上扬的话,那综指将有望在振荡指标形成圆底的情形下出现一个短期上扬的趋势。

总的来说,综指目前算是处于一个技术反弹的格局,不过由于布林频带是处于收窄的情形,所以综指是有倾向于出现横摆巩固的格局。无论如何,若综指能成功上扬突破布林中频带的话,那综指就有望从纯技术反弹转为短期转强的格局了。

Composite Index Daily Technical Analysis 28/01/2009

As indicated by A, the KLCI rebounded 6.94 points on Wednesday, but still below the Bollinger Middle Band. Resistance for the KLCI is still at 887 Fibonacci Retracement while the supports are still seen at 869 followed by 853 Fibonacci Retracement.

As shown on the chart above, the Bollinger Bands Width contracted 5%, suggesting that the KLCI is consolidating again after falling for about a week. Again, the KLCI has to break above the Bollinger Middle Band, or the rebound of the KLCI can only be viewed as technical rebound.

As indicated by B, total market volume declined 23% on the first trading day after the festive holiday, suggesting that the market participation is still very low, as investors are still on the sidelines. Therefore, without sufficient volume, the KLCI is likely to consolidate.

As indicated by C, the MACD histogram begin to tick up, and therefore, might be forming a rounding bottom. If the MACD histogram should form a rounding bottom, it would be a signal suggesting the KLCI is regaining its strength.

In conclusion, the KLCI is now technically rebounding, while likely to consolidate after the rebound, unless it could break above the Bollinger Middle Band with strong volume.

HAPPY INVESTING & GOODLUCK2ALL


If you like the post, please subscribe to Bursa Chat. We will send you the latest post by Email
===> Click
Subscribe to Bursa Chat by Email


BACK TO CHAT BOX
Wednesday, January 28, 2009

Stocks Compilation Table 6 By Zhuge Liang

The table below is a compilation of actively traded stocks with their stop-loss, support and upside targets together with some popular technical indicators. Stock name in bold represents stocks that are expected to attract momentum trading plays and hence encourage retail or short-term trading participation. Share price in bold reflects revised stop-loss, support and upside targets. Recommendation (REC) in bold indicates changes to recent technical calls.

Comments:
We continue to recommend Buy on Dip AMMB and BCHB given the oversold condition on short-term momentum indicators, but revert to Sell on Rally Maybank with immediate upside seen capped below RM5.70. Revert to Buy on Dip TM following the recent decline for technical rebound gains, while we reiterate call to Buy on Dip UEMLand, WCT and Zelan which are expected to see more concerted buying interest on any short-term dips.

Tuesday, January 27, 2009

By Zhuge Liang

If the global economy fails to recover in 2009, the housing bubble or credit crunch may not be to blame. It could be a lack of fire. Chinese fortunetellers say fire — one of the five elements mystics believe form the basis of the universe — is essential to financial well-being. And fire is nowhere to be found in the mythology of this coming Year of the Ox, the Chinese lunar year that begins Monday.

"Fire is the driving force behind economic growth. Without it, the market lacks momentum," said Raymond Lo, a Hong Kong master of feng shui, the ancient Chinese practice of trying to achieve health, harmony and prosperity through building design, the placement of objects and auspicious dates and numbers.
Chinese soothsayers see a deepening recession, millions more losing their jobs, and stocks and home prices continuing to fall. That's more or less in line with what some economists are predicting, but some fortunetellers are throwing in other dire predictions — massive earthquakes, rising U.S.-Russian tensions and trouble for President Obama.

Obama, born in the Year of the Ox, is taking office in a particularly bad year for his Chinese astrological sign. The ox sign is in direct conflict this year with a traditional Chinese divinity called the "God of Year," considered a bad omen. Obama also is the 44th president, a number the Chinese deem extremely unlucky, because "four" is pronounced the same as "death" in Chinese.

"The new U.S. president is not having good luck this year. His honeymoon will only be short-lived," said fortuneteller Alion Yeo, predicting Obama may even face impeachment in his first year in office. "The Year of the Ox looks slightly better and less dire than last year, but it will still be bumpy."

Yeo also predicted that the U.S. mortgage crisis would worsen and the stock market would plunge to new lows. But Malaysian numerologist Weng Shi Ming suggested Obama's birth year would offset his bad luck. Weng said the symmetry of 1961 is "the perfect mix of ying and yang," rendering Obama "immune to the effects of 44."

The ox, one of 12 animals in the Chinese zodiac, symbolizes calm, hard work, resolve and tenacity. According to legend, the ox allowed the cunning rat to ride on its head in a race to determine the animals' order. Shortly before the ox crossed the finish line, the rat leaped off to claim victory. The Year of the Rat was marked in 2008.

The lunar new year is the biggest annual festival for ethnic Chinese, who make up about one-fifth of the world's population. It is a time of lavish spending, when loved ones exchange "hong bao," or red envelopes stuffed with money. But this year's festivities will likely be more subdued amid the economic slump.

"What's important is that the family has a good time.. There's no need to overspend," said Ooi Lee Mui, a Malaysian housewife shopping in Kuala Lumpur's Chinatown, where the season's gold lanterns and bright-hued flowers bedecked streets and stores.

Joey Yap, a feng shui expert in Malaysia, saw no economic recovery before 2010.
"It will be a daunting year. We haven't really reached the peak of the problems yet," Yap said. "We haven't tasted the main dish, and will most likely experience it during the second half of the year."

But feng shui master Lo saw a glimmer of hope. The combination of two elements changes every lunar year, and this time it's two earths, the element that represents harmony and peace. Not since 1949, when the world order was settling down after World War II, has an Ox Year seen two earth signs.

"It is a year for healing ... from the turbulent time the world has experienced,"


If you like the post, please subscribe to Bursa Chat. We will send you the latest post by Email
===> Click
Subscribe to Bursa Chat by Email


BACK TO CHAT BOX

Monday, January 26, 2009

CNY Pictures, Images and Photos
From Ah Seng and Big Boss Zhuge Liang

cny gong Pictures, Images and Photos


Gong Xi Fa Cai

FROM Bursa Chatters


Babe: Kong Hei Ni!

-: HAPI NIU YEAR

KS: seng and all >>> wish u all a happy chinese new year

Evan Koay: Happy Niuuuuuuuuuuuuuuuuuuuuu Yearrrrrrrrrrrr.....................................................................

jean: To all BC chatters, May good fortunes abound and wealth increases in your new year. Gong Xi Fa Cai

...: anyway , GONG XI FA CAI to all here

recouplosses: May the new year bring lots of happiness, joy, luck, wealth and good health

Ross: 龙马精神, 龙马精神, 龙马精神, 龙马精神

chor ko: SUN TEI KIN HONG...CHOI YUEN KONG CHUEN....LUNG MA JING SEN...

Rocky: Wishing BC Chatters Happiness, Good Fortune And Prosperity..

ringgityen: gong xi all

Zhuge Liang : BEHALF ON AH SENG & ZL >>>>> Bursa-Chat WISHES EVERY VISTORS & GUESTS >>>>> A HAPPY GOLDEN YEAR OF THE OX >>>>> GONG XI FA CAI

96: ZL,>>>>> WISHING YOU & FAMILY A VERY2 HAPPY CHINESE NEW YEAR 2009

equities: Lastly, a special geeting “Kong Hei Fatt Choy “ to bro ZL and Ah Seng. Would also like to wish everyone here a very Happy and Prosperous Chinese New Year and may the year of the Ox brings greater wealth and opportunity to everyone here.Enjoy your holidays and come back refresh to a hopefully stronger market .

Zhuge Liang: TQVM Dr Saddiq >>>> GONG XI to Dr & Family. May the year of GOLDEN OX brings HEALTH WEALTH & HAPPINESS

saddiq_sepakraga: ME TOO >>> HAPPY CHINESE NEW YEAR TO MR ZL, AH SENG AND CHINESE FORUMERS...........

TTMMCC: Wishing EVERYONE @ BC a HAPPY CNY AND HOLIDAY!

saddiq_sigaraga: HAPPY CHINESE NEW YEAR TO MR ZL, AH SENG AND CHINESE FORUMERS...........

Intradayman: , cu all after CNY , BYE

cheers: To : ZL. Ah Seng & All Bursa Chatters "HAPPY CHINESE NEW YEAR!"

Ivan: HAPPY CNY TO AH SENG, ZL, WINTER. .. .

ALSO from redstar, KS, Kent, single dot, triple dot and apostrophe


If you like the post, please subscribe to Bursa Chat. We will send you the latest post by Email
===> Click
Subscribe to Bursa Chat by Email


BACK TO CHAT BOX

Sunday, January 25, 2009

By Zhuge Liang

What Does Bid Whacker Mean?
A slang term for an investor who sells shares at or below the bid price. This is considered outside the norm, as sellers normally settle for a price between the bid and ask quotes.

The person is said to "whack the bid down", since selling at or below the bid will usually lower future bids. Bid whacking usually perturbs other sellers, since it may temporarily drive down the market price of a security.

What Does Ponzi Scheme Mean?
A fraudulent investing scam promising high rates of return with little risk to investors. The Ponzi scheme generates returns for older investors by acquiring new investors. This scam actually yields the promised returns to earlier investors, as long as there are more new investors. These schemes usually collapse on themselves when the new investments stop.

The Ponzi scam is named after Charles Ponzi, a clerk in Boston who first orchestrated such a scheme in 1919.

A Ponzi scheme is similar to a pyramid scheme in that both are based on using new investors' funds to pay the earlier backers. One difference between the two schemes is that the Ponzi mastermind gathers all relevant funds from new investors and then distributes them. Pyramid schemes, on the other hand, allow each investor to directly benefit depending on how many new investors are recruited. In this case, the person on the top of the pyramid does not at any point have access to all the money in the system.

For both schemes, however, eventually there isn't enough money to go around and the schemes unravel.

What Does Bulldog Market Mean?

A slang term for the stock market in the United Kingdom. Bulldog market is usually used by non-U.K. residents. It is an allusion to the Great Britain's famous pooch the British bulldog.

The term Bulldog market was used in business slang but has become widely accepted, much like the "Yankee market" refers to U.S. markets and "samurai market" refers to the market in Japan.

Bulldog market is unrelated to the term "bull market" which describes a market on the rise.

If you like the post, please subscribe to Bursa Chat. We will send you the latest post by Email
===> Click
Subscribe to Bursa Chat by Email


BACK TO CHAT BOX

Friday, January 23, 2009

By Zhuge Liang

FKLI Technical Outlook 23 Jan 2009


The KLCI ended marginally higher despite the higher than expected rate cut amid gain in regional market. The KLCI gained 5.6 pts or +0.64% to settle at 879.02 while FKLI spot month fell marginally 1 point lower to settle at 872. FKLI was gyrating in tight range between 878-876 level in the morning session but was off high during the last trading hour. The basis is now at 7 pts discount against cash.

Turnover for spot month contract decreased to 4,812 lots from 5,008 lots while open interest increased slightly to 21,362 contracts from 21,340 contracts.

Ahead of long holiday for Chinese New Year celebration, the market is expected to be lackluster with downward bias. The New Year rally in the past is unlikely to attain tracking at the movement of KLCI within the week. As range-bound trading is expected today, investors may consider to long at around 865 level and short at around 878 (SMA50) levels. The sharp rate cut announced by Bank Negara Malaysia indicates worst economy could be ahead, real impact of financial crisis on Malaysia economy is yet to be revealed. It is unlikely to have any severe slump in near trading days.

SUPPORT >>>>> 868 / 865 / 855

RESISTANCE >> 878 / 885 / 895


FCPO Technical Outlook 23 Jan 2009


Market holding well and rebounded with the resistance at 1872 has been broken to close off the intra day high. Immediate technical outlook shows a slight hook up as period-5 moving below period-15. Stochastic showing momentarily moving sideways in the neutral region with %K is approaching to meet %D at 59% and 60% zone respectively. While, parabolic is maintaining holding short with buy stop adjusted to 2005. Thus, market may continue to trade sideways in near term as indicators show mix view. For now, support is looking at 1790 followed by 1730-1740 and resistance is looking at 1913-1935 (gap leftover on 13/1/2009) followed by 1981-1998.

Immediate trend = Sideways / Higher


FCPO Technical Chart
If you like the post, please subscribe to Bursa Chat. We will send you the latest post by Email
===> Click
Subscribe to Bursa Chat by Email


BACK TO CHAT BOX
By Zhuge Liang


综合指数 2009年 01月 22日

如图中箭头A所示,综合指数出现一个小技术回弹,这使到综指微扬0.6%。如图所示,综指形成一个小十字阴阳烛,这显示综指其实全日出现买方及卖方势均力敌的角力,通常这显示市场对综指的后市仍然感到不明朗所致。综指当前的阻力水平继续的处于887点的胜图自动费氏线,支持水平则分别是869点及853点的胜图自动费氏线。

如图所示,布林频带(Bollinger Band)开始收窄3%,这表示综指下跌的趋势继续的缓和下来,并且有技术回弹的迹象。无论如何,综指还是必须上扬突破布林中频带(Bollinger Middle Band),那综指才能算是结束了这一轮的跌势。

如图中箭头B所示,成交量稍微增加1.5%,所以成交量依然是处于40天平均值以下,这表示市场目前还是属于一个比较淡静的格局,通常在出现低成交量时,综指只是处于一个调整巩固或横摆的格局。

如图中C圈所示,随机指标(Stochastic)%K交割了%D,所以综指出现了周三提到的技术反弹,无论如何,随机指标还是必须上扬突破30%,综指的短期走势才能算是出现短期的转强的趋势。

总的来说,综指在出现了短期超卖后(随机指标跌至0%)的技术反弹,不过综指依然是需要上扬至布林中频带以上的水平,那综指才能算是真正的避开这跌势,不然这转强只能算是纯技术反弹而已。


Composite Index Daily Technical Analysis, 22/01/2009

On Thursday, the KLCI had a minor rebound, closing 0.6% higher as indicated by A. The KLCI formed a doji (Cross) candlestick, suggesting that the market movement on Thursday was mixed, as the direction of the KLCI remains unclear. Resistance for the KLCI remains at 887 Fibonacci Retracement while the supports are still seen at 869 followed by 853 Fibonacci Retracement.

As shown on the chart above, the Bollinger Bands Width contracted 3%, suggesting the KLCI is likely to consolidate. But still, in order to break away from the bearish biased movement, the KLCI has to break above the Bollinger Middle Band.

As indicated by B, total market volume increased 1.5%, but still below the 40-day VMA level. This show that the market overall is still lightly participated as many investors are still staying on the sidelines as the festive holiday is drawing closer. Nevertheless, the lower volume during a consolidation market is considered normal.

As circled at C, the Stochastic %K line successfully crossed above the %D line, as mentioned on Wednesday's analysis, implying a possible technical rebound in the near future. But still, the Stochastic has to break above 30% level in order to signal a beginning of a technical rebound.

In conclusion, the KLCI rebounded slightly after being over-sold (Stochastic hitting 0%), but still remain below the Bollinger Middle Band. Therefore, the immediate outlook for the KLCI is still bearish biased, and the rebound on Thursday is only considered as a technical rebound.

HAPPY INVESTING & GOODLUCK2ALL


If you like the post, please subscribe to Bursa Chat. We will send you the latest post by Email
===> Click
Subscribe to Bursa Chat by Email


BACK TO CHAT BOX

Thursday, January 22, 2009

By Zhuge Liang
What Does Kagi Chart Mean?

A type of chart developed by the Japanese in the 1870s that uses a series of vertical lines to illustrate general levels of supply and demand for certain assets. Thick lines are drawn when the price of the underlying asset breaks above the previous high price and is interpreted as an increase in demand for the asset. Thin lines are used to represent increased supply when the price falls below the previous low
.


An entry signal is triggered when the vertical line changes from thin to thick and is not reversed until the thick line changes back to thin.

One important note about these charts is that they are independent of time and only change direction once a predefined reversal amount is reached.


If you like the post, please subscribe to Bursa Chat. We will send you the latest post by Email
===> Click
Subscribe to Bursa Chat by Email


BACK TO CHAT BOX
By Zhuge Liang
The table below is a compilation of actively traded stocks with their stop-loss, support and upside targets together with some popular technical indicators. Stock name in bold represents stocks that are expected to attract momentum trading plays and hence encourage retail or short-term trading participation. Share price in bold reflects revised stop-loss, support and upside targets. Recommendation (REC) in bold indicates changes to recent technical calls.

Comments:
Given the severe fall on overnight US stocks led by financials on increased fears banks will need more funds to recapitalize or face nationalization, spill-over selling into local banking stocks is a distinct possibility today, hence our revision to SELL AMMB, BCHB, and Maybank. Blue chips such as Sime Darby, TM and TMI remains SELL. On the other hand, while lower liner construction related stocks such as MRCB, Ranhill, UEM Land, WCT and Zelan should also extend downward corrections, we view this as an opportunity to Buy on Sharp Dips as conditions will become grossly oversold, hence paving the way for technical rebound gains going forward.

By Zhuge Liang
Bursa-Chat Market Views - 22 Jan 09

Expect Spill-over Selling From Wall Street, KLCI Downside To 853 Anticipation

The recent losses on overnight US stocks should filter through to further depress sentiment in the Asian region and the local market, hence investors can expect another bleak trading session from the onset today. KLCI is likely to dip towards 869, the 50% retracement support of the upswing from 801 low to 936 high, with stronger support seen at 853, the 61.8% retracement level.

Immediate resistance is at 890, the previous day’s closing, with stronger hurdle at the psychological 900 level.

SELL Banks & Blue Chips; Buy on Sharp Dip Lower Liners
Given the severe fall on overnight US stocks led by financials on increased fears banks will need more funds to recapitalize or face nationalization, spill-over selling into local banking stocks is a distinct possibility today, hence our revision to SELL AMMB, BCHB, and Maybank. Blue chips such as Sime Darby, TM and TMI remains SELL. On the other hand, while lower liner construction related stocks such as MRCB, Ranhill, UEM Land, WCT and Zelan should also extend downward corrections, we view this as an opportunity to Buy on Sharp Dips as conditions will become grossly oversold, hence paving the way for technical rebound gains going forward.

Composite Index Futures (FKLI)
Spot month January KLCI futures contract gapped 13.5 points down to open at 865.0 on Wednesday, fell from high of 875.0 on renewed selling pressure in the afternoon to low of 864.5 after lunchbreak with some recovery before closing -5.5 points or -0.6% down at 873.0. Trading volume dipped moderately to total 6048 versus previous day's 6,846 contracts.

The gap-down to trade below the 30-day SMA yesterday is bearish, with the slight discount to cash implying further weakness in the short-term. Immediate support is revised lower to 860, reinforced by the upper band of the downtrend channel from April 2008 and the lower Bollinger band, while immediate resistance is adjusted to 900. The only positive is the persistently oversold reading on daily slow stochastics signaling technical rebound potential.


# FKLI Spot Chart >>>>>

Photobucket


#Share Buy Back Table >>>>>


Photobucket

If you like the post, please subscribe to Bursa Chat. We will send you the latest post by Email
===> Click
Subscribe to Bursa Chat by Email


BACK TO CHAT BOX
By Zhuge Liang


综合指数 2009年 01月 21日

如图中箭头A所示,综合指数进一步下滑,使到综指继续的处于887点的胜图自动费氏线阻力线以下,所以887点继续的成为综指当前的主要阻力水平,支持水平则分别是869点及853点的胜图自动费氏线。

如图所示,布林频带(Bollinger Band)打开17%,再加上综指处于布林中频带以下,所以综指继续的下滑。由于布林频带打开的幅度有减少的迹象,这显示综指下跌的趋势也有缓和下来的痕迹,无论如何综指将继续的处于下跌的趋势中,直到布林频开始出现收窄的情形为止。

如图中箭头B所示,虽然成交量只稍微下跌2.5%,不过成交量已经处于40天成交量移动平均线(VMA)以下了,所以整体市场继续的属于一个调整的格局中。由于缺乏交投量,虽然这表示综指通常不会出现暴跌的情形,不过综指还是有缓缓下滑的风险。

如图中C圈所示,随机指标(Stochastic)在触及0%后回弹,若%K线交割%D线的话,那综指的短期将有出现转强的迹象,而当%K上扬突破30%时,那将确认综指出现了短期的技术反弹。

总的来说,综指目前仍然是属于一个下跌的趋势中,惟随机指标显示综指有出现技术反弹的迹象,不过这一切都有待随机指标及布林频带进一步的确认。


Composite Index Daily Technical Analysis 21/01/2009

On Wednesday, the KLCI continued its decline, breaking below the 887 Automatic Fibonacci Retracement level, and therefore, the 887 Fibonacci Retracement is now the immediate resistance line for the KLCI, while the next support is at 860 and 853 Automatic Fibonacci Retracement.

As shown on the chart above, the Bollinger Bands Width expanded 17% on Wednesday, with the KLCI below the Bollinger Middle Band. Therefore, the bearish biased movement of the KLCI remains intact. If the Bollinger Bands Width should contract, it would be a signal suggesting a consolidation for the KLCI.

As indicated by B, total market volume declined 2.5%, and still remain below the 40-day VMA level, suggesting that the overall market participation is still low. With the market lightly participated, the KLCI is less like to regain its strength.

As circled at C, the Stochastic rebounded after hitting 0% level, and about to cross above the %D line. If the %K line crosses above the %D line, it is usually implying a technical rebound is likely to take place. But still, the Stochastic has to break above the 30% level to signal a beginning of a technical rebound. To sum up, the immediate outlook for the KLCI is still bearish biased, despite a slightly implication of a possible technical rebound from the Stochastic.

HAPPY INVESTING & GOODLUCK2ALL


If you like the post, please subscribe to Bursa Chat. We will send you the latest post by Email
===> Click
Subscribe to Bursa Chat by Email


BACK TO CHAT BOX

Wednesday, January 21, 2009

By Zhuge Liang

Tanjung Offshore >>> SELL

FY09P/E: 4.2x, P/BV: 0.6x


Continues to gyrate around its medium-term downward channel. Recent
correction may derail the stock towards the RM0.66 and RM0.59 support
levels.

Daily indicators are weakening. MACD signal line has staged a negative
crossover while RSI has dipped into the oversold territory with no bottoming
sign.

Take profit towards the RM0.76 resistance as sustainability remains in
doubt.

Tanjung Offshore Bhd., through its subsidiaries, provides integrated services
and equipment to the oil and gas and related industries in Malaysia. The
company's services include engineering equipment and spare parts, marine
services, and maintenance and other support services

XXXXXXXXXXXXXXXXXXXXXXXXXXXXXXXXXXXXXXXXXXXXXXXXXXXXXXXXX

LBS Bina Group >>> RM0.25 - SELL

FY09P/E: N/A, P/BV: 0.2x

The recent breakthrough above its downward channel may be a bull trap. If
it fails to hold above the 30-day SMA at 0.25, selling may be fierce, possibly
towards the RM0.23-RM0.225 support.

Technical landscape is deteriorating fast. MACD bars are losing momentum
while RSI has hooked down.

Immediate resistance is seen at RM0.27 followed by RM0.285 and RM0.30.
Reduce holdings on upticks.

LBS Bina Group Berhad is a management and investment holding company. The company, through its subsidiaries, operates property development and investment. LBS also provides project management and contractor services for property development, turf and landscaping contracting, insurance services, sells motor vehicles, and trades building materials

XXXXXXXXXXXXXXXXXXXXXXXXXXXXXXXXXXXXXXXXXXXXXXXXXXXXXXXXX

Kinsteel >>> RM0.415 - SELL

FY09P/E: 3.0x, P/BV: 0.4x
The stock is trapped in a bearish “Descending Triangle” formation. A break
below RM0.395 is bearish. Next support is at RM0.35.

MACD is poised to stage a negative crossover while RSI is easing towards
the lower band of the neutral zone.

Sell into strength. Unless it can penetrate above the RM0.435 and RM0.46
resistance levels, the odds remain in favour of the bears.

Kinsteel Berhad is an investment holding company. The company, through its
subsidiaries, manufactures and trades steel bars and related products. Kinsteel also operates in property investment.


If you like the post, please subscribe to Bursa Chat. We will send you the latest post by Email
===> Click
Subscribe to Bursa Chat by Email


BACK TO CHAT BOX
Bursa-Chat Market Views By Zhuge Liang

Further Weakness Likely but Oversold Momentum Could Cushions Downside

Bursa Malaysia shares ended lower on Tuesday as profit-taking picked up momentum following the defeat by the ruling coalition in the Kuala Terengganu by-election last Sunday, which dampened sentiment locally. KLCI fell from opening 885.82 to intra-day low of 878.81 prior to closing at 880.37 to lose 9.19 points, or 1.13% for the day. Losers led gainers 350 to 135 on slower trade totalling 375,819,800mn shares.

Further weakness is likely today given the weak buying momentum on the broader market, with KLCI on the verge of breaking below 880 (the 30-day SMA). The oversold momentum on daily slow stochastic and limited investor participation should cushion downside for shallow profit-taking dip. Immediate resistance is set at the previous 900 psychological support, with 907, which coincide with the 8 Jan pivot low and then 910 acting as stronger resistance.

Photobucket

Lower Liners to Ease Further on Bearish Technical Readings
Banking stocks AMMB and BCHB could dip towards better support from RM2.20 and RM6.00 before more buyers emerge in the current weak market sentiment, while lower liner construction related stocks MRCB, Tebrau and UEM Land should ease further due to short-term bearish technical readings. We will revise our call on Genting, Resorts World and Tenaga to Buy on Dip given the weak buying momentum, hence the higher possibility to buy at cheaper levels.

Photobucket

FKLI

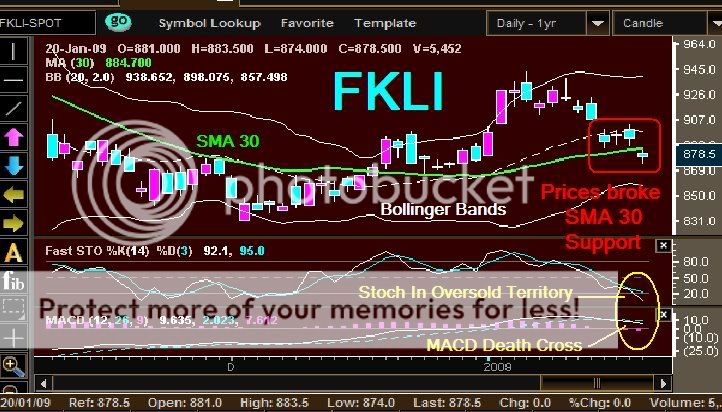
Spot month January KLCI futures contract gapped 11.5 points lower to open at 881.0 on Tuesday, rose to a high of 883.5 in early morning trade before selling off to low of 874.0 before rebounding a little to close at 878.5 for a 14-point loss for the day. Trading volume stayed modest to total 5,452 contracts.

While the immediate outlook remains bearish given the fresh sell signal on daily MACD, the buy signal on daily slow stochastics at the very oversold region implies good technical rebound potential. A reversal to a slight premium from recent discount against the cash index also improves chances for technical rebound. In any case, expect strong resistance from stale bull selling to cap upside below 920.

PLANTATION SECTOR TABLE


Photobucket


CNY Pictures, Images and Photos
From Ah Seng And Big Boss Zhuge Liang


If you like the post, please subscribe to Bursa Chat. We will send you the latest post by Email
===> Click
Subscribe to Bursa Chat by Email


BACK TO CHAT BOX

Tuesday, January 20, 2009

综合指数 2009年 01月 20 By Zhuge Liang


由于亚太市场继续在国际市场传来的坏消息的影响下滑落,综合指数也不例外,周二综指下跌了1.1%。如图中箭头A所示,综指跌破了887点的胜图自动费氏线,所以887点目前反过来成为了综指当前的阻力水平,综指接下来的支持水平则落在869点及853点的胜图自动费氏线。

如图所示,布林频带(Bollinger Band)开始打开(24%),而综指则继续的维持在布林中频带(Bollinger Middle Band)以下,所以综指出现了下跌的趋势。通常综指将继续的下滑,直到布林频带打开的幅度开始减低或收窄为止。

如图中箭头B所示,成交量进一步萎缩10.9%,这使到成交量继续的低于40天成交量移动平均线(VMA),这显示综指目前继续的处于调整巩固的格局里。通常在综指出现下跌趋势时,成交量低并不代表综指跌幅低,这一点与综指上扬时有所不同。

如图中C圈所示,随机指标(Stochastic)已经跌破了30%,所以综指的短期走势目前已经是处于一个下跌的格局中,直到随机指标上扬突破30%为止。无论如何,随机指标已经下跌得非常接近0%的水平,所以这也是综指短期超卖的迹象,有望引发技术反弹,不过若随机指标一日未能突破30%的话,那综指的短期走势还是属于偏弱的。

总的来说,从布林频带的讯号中确定了综指出现了另一轮的跌势,至于综指的跌势何时结束目前则是言之过早,通常随机指标回弹并突破30%或布林频带收窄将是短期跌势结束的第一个讯号。

Composite Index Daily Technical Analysis 20/01/2009

On Tuesday, the KLCI was hit by negative news across the region, closing 1.1% lower. As indicated by A, the KLCI fell below the 887 Fibonacci Retracement and the next support for the KLCI is at 869 followed by 853 Fibonacci Retracement.

As shown on the chart above, the Bollinger Bands Width expanded 24%, with the KLCI below the Bollinger Middle Band. Therefore, the expansion of the Bollinger Bands Width suggesting a bearish movement for the KLCI. The bearish movement for the KLCI is expected to continue until the Bollinger Bands Width contracts again.

As indicated by B, total market volume declined another 10.9%, with volume staying below the 40-day VMA level. This shows that the market participation is relatively lower, thus the KLCI is losing its strength.

As circled at C, the Stochastic is still below 30% level, which is the short term bearish region. Therefore, the short term bearish movement of the KLCI continues, until the Stochastic break above the 30% level successfully. Meanwhile, since the Stochastic is nearly at 0%, it suggests that the KLCI might be over-sold, and therefore, a technical rebound is likely to take place in the near future. But still, to confirm the technical rebound, the Stochastic has to break above 30% level. Until that, the short term movement of the KLCI is still on the negative side.

In conclusion, the Bollinger Bands Width has shown a bearish direction for the KLCI, and for now, the bearish movement of the KLCI is likely to continue until the Bollinger Bands Width should contract, which would suggest another consolidation for the KLCI.

HAPPY INVESTING & GOODLUCK2ALL
CNY Pictures, Images and Photos
From Ah Seng And Big Boss Zhuge Liang


If you like the post, please subscribe to Bursa Chat. We will send you the latest post by Email
===> Click
Subscribe to Bursa Chat by Email


BACK TO CHAT BOX
Troubled Asset Relief Program - TARP By ZHUGE LIANG

What is TARP?
A government program created for the establishment and management of a Treasury fund, in an attempt to curb the ongoing financial crisis of 2007-2008. The TARP gives the U.S. Treasury purchasing power of $700 billion to buy up mortgage backed securities (MBS) from institutions across the country, in an attempt to create liquidity and un-seize the money markets. The fund was created by a bill that was made law on October 3, 2008 with the passage of H.R. 1424 enacting the Emergency Economic Stabilization Act of 2008. The Treasury will be given $250 billion immediately, and the President must certify additional funds as they are needed. The additional funds will be distributed as $100 billion, and then as the final $350 billion is given, Congress has the right to not approve the additional amounts.

Global credit markets came to a near stand still in September 2008, as several major financial institutions, such as Lehman Brothers, Fannie Mae, Freddie Mac and American International Group, went under. In a few surprising moves, heavyweights Goldman Sachs and Morgan Stanley even changed their charter to become commercial banks, in an attempt to stabilize their capital situation. The bailout will attempt to increase the liquidity of the secondary mortgage markets by purchasing the illiquid MBS, and through that, reducing the potential losses that could be felt by the institutions who currently own them.

In October of 2008, revisions to the program were announced by Treasury Secretary Paulson and President Bush; allowing for the first $250 billion to be used to buy equity stakes in nine major U.S. banks, and many smaller banks. This program demands that companies involved lose some tax benefits, and in many cases incur limits on executive compensation.


If you like the post, please subscribe to Bursa Chat. We will send you the latest post by Email
===> Click
Subscribe to Bursa Chat by Email


BACK TO CHAT BOX
Composite Index Daily Technical Analysis 19/01/2009 By Zhuge Liang

On Monday, the KLCI continued its consolidation, closing 0.7% lower to 890.28 points. Support for the KLCI remains at 887 Automatic Fibonacci Retracement while the resistance is still at 900 psychological level. (Study A)

As shown on the chart above, the Bollinger Bands Width expanded only 5%, and therefore, it is still insignificant to be considered as any signal, for the expansion of the Bollinger Bands Width has to be obvious in order to signal a direction for the KLCI.

As indicated by B, total market volume declined 22.8%, suggesting that the KLCI is still consolidate, and no sign of any panic selling. But still, if the KLCI should attempt to rally and retest its resistance, volume above the 40-day VMA level is an important element to support the KLCI momentum.

On Monday, the MACD continue to fall, suggesting that the KLCI is still losing strength. In short, the MACD histogram has to form a rounding bottom as indicated by the C arrow in order for the KLCI to regain some strength.

To sum up, the direction for the KLCI remains unclear. If the Bollinger Bands Width should expand with the KLCI below the 40-day VMA level, it would be a bearish biased movement for the KLCI.. Therefore, the KLCI must break above the Bollinger Middle Band in the near future in order to avoid the bearish biased movement.

综合指数 2009年 01月 19日

如图中箭头A所示,综合指数再度出现调整的格局,稍微下跌0.7%。综指当前的支持水平仍然是887点的胜图自动费氏线,阻力水平则是900点的心理阻力关口。

如图所示,布林频带(Bollinger Band)稍微打开5%,所以虽然综指已经处于布林中频带(Bollinger Middle Band)以下了,综指还是不至于确定出现一个下跌的趋势。通常布林频带是必须明显的打开,那才能确定综指出现了跌势。换句话说,只要综指能在近期内回弹,并且上扬突破布林中频带的话,那综指就能避开形成一个新的跌势。

如图中箭头B所示,成交量在综指下滑的当儿再度减少22.8%,这表示综指虽然仍然是处于一个调整巩固中,不过市场还不至于出现慌张抛售的情形。无论如何,若综指再度出现上扬时,成交量是必须增加至40天成交量移动平均线(VMA)以上,那综指的涨势才能更持久。

平均乖离的振荡指标(MACD Histogram)目前跌破了零轴进入了负值区域,这表示综指当前正在出现短期的调整,通常振荡指标是必须要形成一个如箭头C般的圆(Rouding Bottom),那综指才有望止跌后出现技术反弹。

总的来说,综指目前正处于一个关键性的水平,因为若综指继续的滑落,那将触发布林频带打开而形成一个新的趋势。所以综指必须短期内回弹上扬,综指才能避免进一步的形成下跌趋势

If you like the post, please subscribe to Bursa Chat. We will send you the latest post by Email
===> Click
Subscribe to Bursa Chat by Email


BACK TO CHAT BOX

Monday, January 19, 2009

Chartroom Spectrum

Monday, January 19, 2009 0 Comments
Chartroom Spectrum By ZHUGE LIANG

What happened over the past fortnight could be an indication on what would be in store for global equities for the rest of the year. Just into the first half month of 2009, share prices around the world have already seen wild gyrations from one timeframe to the next. After staging a positive start to the year, many stock
exchanges across the region gave back their initial gains last week. The steepest weekly losses were registered by Hong Kong (-7.8%), China shares listed in Hong Kong (-7.5%) and Japan (-6.9%) as seven of the 11 Asian markets that we track showed negative year-to-date returns now.

The seesaw performance was also apparent on our Malaysian bourse. Its benchmark Kuala Lumpur Composite Index (KLCI) fell on four of the five days to post a cumulative drop of 22.6-points or 2.5% for the week. At a close of 896.47, the KLCI is still treading in positive territory (up marginally by 2.2% so far this year). However, beneath the top liners, the picture was less rosy: the FBM Second Board Index was up 0.5% last week but down 0.1% year-to-date while the FBM Mesdaq Index lost 2.7% last week (translating to a year-to-date change of minus 1.4%). Daily average volume, meanwhile, slowed to 538.8m shares valued at
RM674.3m (from 632.3m units worth RM891.6m the week before)..

There will be no lack of events to drive stock markets, here as well as overseas, in the coming fortnight. On the external front, all eyes will be on the inauguration of a new U.S. president on Tuesday (20 Jan). From the investors’ perspective, their thoughts will be on whether his action plans (announced and to be announced)
are enough to overturn the ailing fortunes of the world’s biggest economy after he assumes power. Their focus will also be on what more the new U.S. administration can do following the proposal to undertake aggressive pump priming measures on a mind-boggling scale, whose effectiveness will only be known upon subsequent implementation.

The fiscal stimulus tool (in the form of public spending, tax cuts etc), nevertheless, seems to be the better option for now when compared to the monetary policy. This comes as the U.S. Federal Open Market Committee (FOMC) is set to meet next Tuesday and Wednesday (27-28 Jan). With less flexibility in hand after cutting its benchmark federal funds rate to near zero already, the policymakers are expected to reaffirm its intention to pursue quantitative easing and support the functioning of credit markets, while providing an update on the macroeconomic developments.

Prior to the FOMC gathering, our Bank Negara Malaysia will decide on Wednesday (21 Jan) whether to adjust its overnight policy rate. While the expectation is for the central bank to lower the rate to stimulate economy activity amid a faltering outlook, it remains to be seen if they will do so as soon as in the upcoming meeting (after the 0.25% cut in Nov). Other economic reports due include the Consumer Price Index for Dec (this Wednesday, 21 Jan) and the international reserves as at 15 Jan (this Thursday, 22 Jan). Separately, the corporate earnings season will be underway with the likes of Tenaga (today) and Public Bank (around midweek)
scheduled to publish their latest quarterly report cards ahead.

On the Malaysian stock exchange, as the Earth Rat makes way for the Earth Ox to moo in on 26 Jan, investors may want to be on the sidelines in the run-up to the extended Chinese New Year break given the wobbly overseas markets. Talking about Chinese New Year traditions, the celestial readings say the Year of the Earth Ox will likely see a slow stock market as the ongoing adjustments for past excesses stretch on with bumpy rides along the way.

Photobucket

Technically, the KLCI – which has retreated from a recent high of 936.63 to mark its first decline in three weeks – is expected to show further weaknesses ahead. On the verge of slipping back into its negative sloping channel, we reckon the key market barometer appears susceptible to crack below its immediate support level of 890 anytime soon. If so, the return of fresh selling interest may then push the KLCI towards its next support line of 860. On the upside, a resistance barrier is seen at 930

Photobucket

Photobucket

If you like the post, please subscribe to Bursa Chat. We will send you the latest post by Email
===> Click
Subscribe to Bursa Chat by Email


BACK TO CHAT BOX