Technical | Fundamental Analysis Discussion Stocks Listed In Bursa

Friday, October 31, 2008


Composite Index Daily Technical Analysis 30/10/2008 by Zhuge Liang

The KLCI ended 2.9% higher on Thursday, in line with the Asian markets as triggered by news of the US Federal Reserve cutting key interest rate. As indicated by A, the KLCI is now testing the T2 line, which is also at the similar level of the Bollinger Middle Band dynamic resistance. Therefore, this is likely to be a stronger resistance. Support for the KLCI is at 800 mark while the resistance is still at 887 Fibonacci Retracement.

As shown on the chart above, the Bollinger Bands Width contracted 10%, suggesting a consolidation or technical rebound signal for the KLCI. Generally, the first target for the KLCI would be the Bollinger Middle Band. If the KLCI should break above the Bollinger Middle Band, it would improve the immediate outlook for the KLCI.

As indicated by B, total market volume increased 49.5%, which is a 7 month new high level. The increased of volume was associated with the rising of price, thus a positive signal suggesting some increased of buying interests in the market. Therefore, if the KLCI should continue to rebound with volume staying above the 40-day VMA level, the market sentiment is likely to improve.

As circled at C, the Stochastic breaks above 30% level, thus a signal suggesting a beginning of a technical rebound. If the Stochastic should continue rising, the rebound is expected to continue. If the Stochastic should break above 70% level, it would be a short term bullish signal for the KLCI.

综合指数 2008年 10月 30日 by Zhuge Liang

在美国联邦储备局减息的影响下,亚太股市纷纷上扬,这也带动综合指数上扬2.9%。如图中箭头A所示,综指接下来将面对T2趋势线的阻力,这也将是布林中频带(Bollinger Middle Band)的动态阻力水平,所以阻力预料将倍增。

综指当前的支持水平仍然是800点的胜图自动费氏线,这也是一个心理支持水平,阻力水平则是887点的胜图自动费氏线。

如图所示,布林频带(Bollinger Band)收窄10%,这表示综指一反之前的跌势,而出现了技术回弹的格局。通常综指将有望回弹至布林中频带这水平,而布林中频带将成为综指的动态阻力线。若综指能成功的上扬突破布林中频带的话,那综指就将有望从技术反弹转为上扬的趋势。

如图中箭头B所示,马股的成交量增长49.5%,创下7个月来的新高水平,这表示整体市场交投继续的热炽。无论如何,当综指出现上扬或转强时,成交量能达到40天成交量平均值(VMA)都是对综指有正面的影响。

如图中C圈所示,随机指标(Stochastic)上扬突破30%,这确认综指短期出现技术反弹。通常若随机指标能继续的攀升,那综指的技术反弹将有望维持下去,而当随机指标上扬突破70%的话,那综指将出现短期上扬的涨势,直到随机指标反过来跌破70%为止。

Thursday, October 30, 2008

The 5 Most Feared Figures In Finance by Zhuge Liang


Every Halloween there is no shortage of children dressed up as vampires, werewolves and witches. If, however, a child truly wanted to inspire horror in the adults handing out the sweet candy treats, he or she would be better to put on a suit, tie and wing-tipped shoes, and threaten to topple the market. In this article, we'll take a look at the frightening financial figures that caused terror on Wall Street.

No. 5 - Bill Gates
Bill Gates is best known for being one of the richest men on the planet and the founder of tech company giant, Microsoft. The thing that helped him and his company establish a near-perfect dominance over the market was not a superior level of technology, but Gates' business acumen and cutthroat competitiveness. When Microsoft exploded onto the scene with MS-DOS, Excel, Word and then Windows, many investors wondered why the profits weren't being paid out in juicy dividends. It soon became apparent that Bill Gates was building a war chest of unbelievable size.

Investors who would usually try to sway the board of directors to disperse the profits were unusually silent as Bill Gates plotted a course for Microsoft that would make it one of the largest companies in the world. Microsoft now has billions of dollars held in reserve that can be used as a weapon or a shield, depending on what the situation calls for. Whether it is facing down anti-trust lawsuits or carving out new markets for his company, Bill Gates and his 800-pound gorilla are very intimidating.


No. 4 - George Soros
George Soros has been described as a pirate and is despised in locations as various as Thailand, Britain and Malaysia. This famous currency speculator has made a fortune breaking currencies. In breaking the Bank of England, Soros became a figure to be feared by countries trying to protect fragile currencies. Soros is far from a numbers-only speculator. He looks in-depth at a country and tries to spot errors in valuation; political policies in particular draw his interest. Active in philanthropy focused on bringing about political change, Soros also uses his currency positions to "punish" countries whose policies are ignored in favor of positive economic data by most speculators. By pressuring these governments financially, Soros can force political changes that might never come about otherwise. Governments may fear him, but the citizens of these countries may ultimately thank him. Though feared on Wall Street, charities and nonprofit groups adored both Soros and Gates.


No. 3 - Carl Icahn
Carl Icahn is a one-time raider who can be credited with prompting more Securities and Exchanges Commission regulation than any other individual.

Icahn was the creator of greenmailing and one of the primary reasons that disclosure rules are so strict once stock holdings creep to the level of a toehold purchase. Icahn did everything from stripping assets and forcing stock buybacks, to personally dressing down CEOs and board members.

Now, hemmed out of raiding by the SEC, Icahn buys controlling or even minority interests in companies that he considers to be undervalued. He then outlines his plan for creating value - ranging from spinning off profitable units, buying back stock, or simply cutting down excess overhead costs - and threatens a proxy war if his "advice" is not followed. With his reputation, a company may even see a jump in price just by calling down the wrath of Icahn on its slumping stock. Carl Icahn works to create value for the shareholders now, rather than stealing it from them, but a meeting with Icahn is still enough to give underperforming and overpaid CEOs the shakes.


No. 2 - John D. Rockefeller
John D. Rockefeller may be the most terrifying figure in finance. He was the richest man in the world and still ranks as the richest man in modern history. His company, Standard Oil, controlled 90% of the American oil industry and was infamous for forcing competitors to bankruptcy and then buying their assets from their creditors. But the thing that made him truly terrifying was his absolute belief in what he was doing. Rockefeller saw cutthroat competition as a ruinous practice that benefited the consumers much less than it ultimately hurt business. Rockefeller saw greater profits and greater benefits could be achieved by the practice of "combination", now called "economies of scale".

Rockefeller is remembered for his hard ball practices of using the immense wealth of Standard Oil to cause train and barrel shortages that ruined his competitors and forced them to come to his side, but he should also be remembered for emphasizing research and development, reducing harmful waste and passing savings onto consumers. There is no doubt that his driving sense of purpose and the means he employed to achieve his ends were not all good, but there is as much to admire about Rockefeller as there is to fear.
No. 1 - J.P. Morgan
J.P. Morgan was a wealthy man, but not near the scale of a Rockefeller or even a Gates. What J.P. Morgan had more of than any other person on this list was pure power. During his lifetime it was said that God owned men's souls and J.P. Morgan owned the rest. The power that Morgan wielded owes as much to timing as to his personal attributes. Morgan was the primary banker for Wall Street, underwriting companies like General Electric and International Harvester at time when the American economy was getting ready to explode. At the time, a bank's reputation decided whether an issue would sell rather than the strength of the company's financials, and Morgan's reputation was gold.

The moment when Morgan was at his most powerful and terrifying, however, came during the Bank Panic of 1907. Morgan personally gathered all the financial and political movers at his mansion and forced them into locked-door negotiations to resolve the crises. The idea that the entire American economy relied on one aging banker to keep it afloat scared the government so badly that the Federal Reserve Bank was created to prevent a similar situation in the future.

Conclusion
The word terrifying is apt for these men. The names Gates, Soros, Icahn, Rockefeller and Morgan all embody enough power (financial, mental and political), to inspire awe, respect and, consequently, fear. It is unlikely that they will ever inspire their own costume line, but they will forever cause chills down the spines of bankers, investors and financial figures alike

aka The 5 Sharks Of Wall Street

Wednesday, October 29, 2008

KLCI Good support around 800

28th October: Approached, breached & rebounded off arithmetic target of 830 amid strong support.

Medium term:


1. Head and Shoulders top daily chart points to 910 - done (log), 830 (arithmetic tested rebound)

2. Head and Shoulders top weekly chart points to 930 - done (log), 860 - done (arithmetic violated) Log done.

Next good support at 800

Composite Index Daily Technical Analysis 28/10/2008


On Tuesday, the KLCI opened gap down, tested the 800 psychological level before rebound to close at 832.44 points. As mentioned earlier, the 800 points level is the target level for the Head and Shoulder Top pattern, and therefore, the 800 mark is an important level for the KLCI.

As indicated by A, the KLCI formed a long lower shadow candlestick (Hammer), which suggests a chance of a technical rebound for the KLCI. Support for the KLCI is at 800 points while the resistance is at 887 Fibonacci Retracement.

As shown on the chart, the Bollinger Bands Width expanded another 30%, with the KLCI below the Bollinger Middle Band, and therefore, suggesting the immediate outlook is still bearish biased. Generally, the bearish movement is expected to continue unless the Bollinger Bands Width should begin to contract.

As indicated by B, total market volume declined 5.3%, but still above the 40-day VMA level. This shows that the overall market participation is relatively active. If the KLCI should rebound with higher volume, it would be a positive sign. However, if the KLCI should continue to fall with high volume, it would be a sign of increasing selling pressure.

As circled at C, the Stochastic is still below 30%, suggesting the short term movement for the KLCI is still bearish biased, and the bearish biased movement is expected to continue unless the Stochastic should break above 30% level.

综合指数 2008年 10月 28日

在全球股市在经过“黑色星期一”下跌的影响下,综合指数开市以下跌跳空,出现了一个缺口(Gap),惟综指在800点的水平获得扶持,这正是我们一直提到的头肩顶(Head & Shoulders)的下跌第一个目标。这800点的水平是综指在跌破了头肩顶的颈线(Neck Line)后,综指下跌的第一个目标,也是可能出现的支持水平。

如图中箭头A所示,综指在出现技术反弹后形成一个长下影线(Long Lower Shadow)的阴阳烛,这也是锤形线(Hammer),这表示综指接下来有望出现回弹的格局。综指当前的支持水平是800点,阻力水平则是887点的胜图自动费氏线。

如图所示,布林频带(Bollinger Band)进一步打开30%,而综指已经处于布林中频带(Bollinger Middle Band)以下了,所以综指进一步下跌。通常综指将继续的处于跌势中,直到布林频带收窄或打开的幅度减低为止。

如图中箭头B所示,成交量稍微减少5.3%,不过仍然是处于40天成交量移动平均线(VMA)以上,这显示市场仍然是相当活跃的,这也表示投机活动也相当的高。无论如何,这些活动都加剧了综指的跌势。

如图中C圈所示,随机指标(Stochastic)依然维持在30%以下,这表示综指的短期走势依然属于跌势中,直到随机指标上扬突破30%为止。

HAPPY TRADING & GOODLUCK2U BY Zhuge Liang

Tuesday, October 28, 2008

First of all, let's remember that bears are sluggish and bulls spirited and burly. The terms are used to describe general actions and attitudes, or sentiment, either of an individual (bear and bull) or the market. A bear market refers to a decline in prices, usually for a period of a few months, in a single security or asset, group of securities or the securities market as a whole. A bull market then is when prices are rising.
The actual origins of these expressions are unclear. Here are two of the most frequent explanations given:

1. The terms bear and bull are thought to derive from the way in which each animal attacks its opponents. That is, a bull will thrust its horns up into the air, while a bear will swipe down. These actions were then related metaphorically to the movement of a market: if the trend was up, then it was considered a bull market, and if the trend was down, then it was considered a bear market.

2. Historically, the middlemen in the sale of bearskins would sell skins they had yet to receive. As such, they would speculate on the future purchase price of these skins from the trappers, hoping they would drop and thus increase their own profits due to a spread - the difference between the cost price and the selling price. These middlemen became known as "bears", short for bearskin jobbers, and the term stuck for describing a decrease in the market. Conversely, because bears and bulls were widely considered to be opposites due to the once-popular blood sport of bull-and-bear fights, the term bull was used to describe actions or sentiment that is the opposite of bears.

Wherever the term came from it is important for investors to know the difference between the two as it will greatly affect their returns. For example, it is unwise to be a bull in a broad-based bear market, because prices will be falling while you're hoping they will rise and the value of your portfolio will fall. Also be aware that it is possible to profit in both markets and that there are in fact two sides to the stock market - and up and a down one. Thus, like their namesake, never turn your back on a bull market or a bear market.

HAPPY TRADING FOLKS............Zhuge Liang

Friday, October 24, 2008


Composite Index Daily Technical Analysis 23/10/2008

As indicated by A, the KLCI ended lower on Thursday as poor performance across regional markets, and the KLCI managed to rebound slightly after hitting T2 downtrend dynamic support. Generally, as shown on the chart, the downtrend channel of T1 and T2 remains intact.

Support for the KLCI is at 880 points while the resistance is still at 900 psychological mark followed by 950 Fibonacci Retracement. Meanwhile, the Bollinger Middle Band is still the dynamic resistance for the KLCI, and as long as the KLCI is still resisted by the Bollinger Middle Band, the immediate outlook for the KLCI is still bearish biased.

As shown on the chart, the Bollinger Bands Width expands 2%, with the KLCI below the Bollinger Middle Band. Therefore, if the Bollinger Bands Width should continue to expands, more downside risk for the KLCI is expected.

As indicated by B, total market volume increased 13.5%. Since the KLCI ended lower, the higher market volume actually suggested an increased of selling pressure.

As circled at C, the Stochastic remains below 30%, which is the short term bearish region. Therefore, this suggests that the market movement for the short term is still weak. If the Stochastic should touch 0%, it would be a signal suggesting an over-sold condition for the KLCI, thus a technical rebound is likely to take place. But, still, the market movement for the short term is still bearish biased.

综合指数 2008年 10月 23日

综合指数在亚太区股市下跌的阴影笼罩下再度下滑,惟如图中箭头A所示,综指在T2这下降趋势线获得扶持而稍微回弹,所以T2继续的成为综指当前的支持水平。整的来说,综指仍然是处于T1及T2趋势线组成的下降趋势线内。
综指当前的支持水平是880点,阻力水平则是900点的心理阻力水平以及950点的胜图自动费氏线。另一方面,布林中频带(Bollinger Middle Band)也将是综指上扬时的动态阻力线,通常若综指一日未能上扬突破布林中频带的话,那综指就一日不能成功的转强。
如图所示,布林频带(Bolinger Band)稍微打开2%,这表示综指延续之前的趋势:由于综指是处于布林中频带以下,所以综指继续出现下跌的趋势。
如图中箭头B所示,虽然综指下跌,不过马股成交量反而增长13.5%,这表示投资者在惊慌抛售下乘低吸购低价的股项,以赚取技术反弹的溢价,惟这些活动也加剧了综指当前的跌势。
如图中C圈所示,随机指标(Stochastic)仍然维持在30%以下,所以综指的短期走势仍然是属于下跌中。通常综指将一直维持在短期跌势中,直到随机指标上扬突破30%为止。另一方面,若随机值标跌至0%的话,那将表示综指出超卖的现象,有望出现纯技术反弹。

Composite Index 23/10/2008 综合指数 2008年 10月 23日 By Zhuge Liang

Thursday, October 23, 2008


klci22102008

USD_Index


djiaWEEKLY22Oct08


djiaP&F22)ct08


djia22102008

To say that the market is grossly oversold is not exactly breaking news because it has been oversold for at least a few weeks; however, the oversold condition has been steadily getting worse over that time, and we have perhaps reached the limit of how oversold the indicators will get without the market taking some time to clear the condition. Keep in mind that the condition can be cleared if the market merely drifts sideways while indicators drift higher toward neutral territory, but, considering the kind of volatility we have been experiencing, a few technical rebouds is not being over optimistic.

Since Wall Street is extremely oversold, then we have plenty of evidence that a rally is due. ZL do not for one minute believe the bear market is over, but it does not seem reasonable that the vertical descent will continue unabated. Reasonable? Perhaps that is not the best word to use in these circumstances. Let's just say that the technicals are screaming for a good sized bounce. Having said that, ZL will leave you with a reminder that we are playing by bear market rules. Oversold conditions are extremely dangerous and do not always present opportunities on the long side.

The DJIA tanked again last night .... down -514.45 pts. BECAREFUL!

IS THIS THE BUFFETT-BOTTOM?
Warren Buffett said he was buying stocks these past couple of weeks. Should you? Well, it depends. If you buy stocks on a regular basis as part of a disciplined strategy, then keep buying. The idea of buying stocks over the long haul is not only to buy when the market is soaring, but more importantly, to also buy when the market is falling. The key element is your time horizon. If you don't need the money for the next 5-10 years, then you stay invested and keep buying.

Here's the problem. Fewer and fewer of Americans buy and hold. We've seen many of our strongest companies buckle and went belly up. Most financial companies have been brought to their knees during this financial crisis and the crisis is threatening to take many other sectors with it. American International Group (AIG) was thought to be a darling among Wall Street analysts. We don't need to detail the woes of AIG, just suffice it to say that no company is immune to failure. So if you're of the buy-and-hold mentality, remain diversified.

ZL is not of the buy-and-hold mentality and never will be - in a few instances maybe but definitely not a die hard porfolio junkie. Technical analysis is where it's at. When the first signs of technical weakness appear, beware. Let sectors regain relative strength before committing back into the group. This very simple strategy avoids major carnage and it's the major carnage that wrecks portfolios, not the minor losses from timing a trade incorrectly

Wednesday, October 22, 2008

Memo to: Oaktree Clients
From: Howard Marks
Re: Nobody Knows

The title of this memo isn’t a joke; I mean it. Nobody knows the real significance of
the recent events in the financial world, or what the future holds. Everyone has an
opinion – there’s an off-color joke to that effect – but opinions are entirely different from
knowledge. As usual, the bulls are optimistic, the bears are pessimistic, and the rest are
uncertain.

This is a great time for my favorite quote from John Kenneth Galbraith: “There are two
kinds of forecasters: those who don’t know, and those who don’t know they don’t know.”
No one knows about the future, and that’s more true now than ever . . . literally.

Excesses were committed at financial institutions that we’ve never seen before in terms
of their scale or their breadth, and many new inventions are in place that never existed
before. So clearly no one can know how things will pan out.

My conviction that this is true frees me from having to methodically assess the strength
and weakness of economies and institutions, and it permits me to limit my comments to
what I consider strategic realities.

I’m flattered that people have asked for my opinion, and I will give it. But that’s all it is:
an opinion. In setting it down, I will repeat things I’ve written before. So if you find
something that you think you’re reading for the second time, you’re probably right.

Boom-Bust
Those two words say it all. If you have a boom, eventually you’ll have a bust. And
the further the boom goes, the worse the bust is likely to be. If there’s no boom, on the
other hand, there needn’t be a bust.

There was no great boom in the U.S. economy in 2003-07, and that’s one of the reasons
why it has held up reasonably well despite the recent turmoil.

But there was an incredible boom in the financial sector, and it has led to an incredible
bust. (It remains to be seen whether its effects will slop over into the real economy. As
you know, we think they will.)

Finally, there wasn’t a boom in the U.S. stock market, and so it hasn’t busted. (If you
think your stocks have given you pain, realize that their decline isn’t at all commensurate
with the end-of-the-world thinking roiling the financial sector).

Page 2


How Things Got This Way
Much of the current problem can be attributed to a decades-long bubble in the financial
sector that made it the employer of obvious choice; attracted employees who were “the
best and the brightest” (although often untrammeled by experience); contributed to greed
and risk taking; drove out fear and skepticism; and carried institutions, behavior,
expectations and asset prices to unsustainable levels.

What are the factors that got us in the current mess?
• Excess liquidity, which had to find a home.

• Interest rates that had been reduced to stimulate the economy.

• Dissatisfaction with the resulting prospective returns on low-risk investments.

• Inadequate risk aversion, and thus a willingness to step out on the risk curve in search
of higher returns.

• A broad-scale willingness to try new things, such as structured products and
derivatives, and to employ massive leverage.

• A desire on the part of financial institutions to supplement operating income with
profits from proprietary risk taking – that is, to be “more like Goldman.”

• A system of disintermediation, selling onward, and slicing and dicing that caused
many participants to overlook risk in the belief that it had been engineered away.

• Excessive reliance on rating agencies which were far from competent to cope with the
new instruments, and on black-box financial models that extrapolated recent history.

• Unquestioning acceptance of financial platitudes without wondering whether altered
circumstances and elevated asset prices had rendered them irrelevant:
o Houses and condos are good investments and can be counted on to appreciate.
o Mortgages rarely go into default.
o There can never be a nation-wide decline in home prices.
o It’s okay to grossly lever a balance sheet if you’ve hedged enough through
derivatives.
o It’s safe to borrow and invest funds equal to a huge multiple of your equity
capital if the probabilistic expected value is positive, because “disasters rarely
happen.”

• Individuals such as mortgage brokers and mortgage borrowers who were given
incentives to do the wrong thing.

• Newly minted financial “masters of the universe” encouraged to maximize returns for
themselves and their employers without concern for whether they were adding value
to the financial system or endangering it.

In general, the above can be summed up as a shortage of adult supervision, common
sense, skepticism, ethical concern and good old-fashioned prudence. As often happens in
booms, the kids shouldered the adults aside or impressed them too much.

The list of errors can make you laugh . . . or cry. I mentioned in “Hindsight First, Please”
how often financial people do things that look downright silly afterwards. But that never
stops them from repeating the old mistakes or making new ones.

Page 3

So now we find financial institutions that endangered themselves by using extensive
short-term borrowings or deposits to make investments that turned out to be
enormously risky when an unlikely disaster – a nationwide decline in home prices –
occurred.

In many ways, changes in the environment contributed as well. They crept up one by
one, unnoticed, but their combined effect is significant. For example,
• The Glass-Steagall Act was repealed, permitting banks and investment banks to
combine. (It had been enacted in 1933 to outlaw such combinations because they
were felt to have contributed to the Crash of ‘29. It’s ironic – and certainly not
irrelevant – that it was repealed in 1999, in time to contribute to the current credit
crunch.)

• The rule limiting short sales to up-ticks was revoked in July 2007, enabling short
selling to force stock prices down unabated.

• Derivatives were created whose prices were determined by the price of their “real”
underlying securities; now we see that in an Alice-in-Wonderland way, they’re able
to influence the price of real securities (see below).

• And mark-to-market accounting exposed precariously leveraged institutions to the
risk that technically-driven declines in asset values might leave them too weak to
make it through to a better day.

It was during my working lifetime that the phrase “too big to fail” was coined. More
recently, Citibank caused some people to observe that it had become too big to manage.

In the current go-round, financial institutions have been described as too big to
understand and, finally, too big to disentangle (given the proliferation of derivatives and
swap transactions, a key element in assessing an institution’s essentialness is the degree
of counter-party risk it presents to others). There’s no doubt that these developments are
frightening. But heroes aren’t people who’re unafraid, but rather those who act bravely
despite their fears. Investors mustn’t let emotion control their actions.

Because of this combination of altered behavior, financial innovation and changes in
the environment, I feel unable to tell you what lies ahead. But that doesn’t mean

I’m not going to suggest a course of action.

Does the Market Know?

For reasons both systematic and unsystematic, the market is in many cases taking
its lead from . . . the market. Price declines cause fear, and thus further price
declines.

In some cases, the signal for increased worry comes from increases in the price of credit
default swaps, which provide insurance against debt defaults. Rising CDS prices imply
that creditors have become more concerned. This can send down the prices of a

Page 4

company’s stock and debt instruments and frighten customers and depositors into
withdrawing funds, potentially leading to downgrading and failure. In other words,
increases in prices for credit insurance can serve as self-fulfilling prophesies. This is the
unintended consequence of one of the recent innovations.

I want to mention the potential for manipulation present in this situation. One strong bid
for default protection in the thin market for CDS on a given company can massively
depress the price of billions of dollars worth of stock and/or debt. Clearly, an
unscrupulous short-seller can use this tactic to his advantage. No one knows the extent to
which it is in play . . . or how to stop it.

In the end, people once again have to apply skepticism and their own judgment, this
time to bad news. Is the market smart or dumb? Is it giving us a valid signal to get
out or the buying opportunity of a lifetime? I seem to remember a useful quotation to
the effect that “The market is an ass.” Thus I think there’s more money to be made by
being a contrarian than a trend follower.

The End of the Financial System
We’re seeing and hearing things today that we never imagined.

• The demise or bailout of Lehman Brothers, Bear Stearns, Freddie Mac, Fannie Mae
and AIG.

• Concern about the viability of Goldman Sachs and Morgan Stanley, and huge
declines in their stocks.

• Rising prices for CDS protection on U.S. Treasury securities.

• Rates on short-term T-bills close to zero because of an extreme flight to safety.

• Awareness for the first time, I think, that the U.S. government’s financial resources
are finite, and that there are limits on its ability to run the printing press and solve
problems.

Will the financial system melt down, or is this merely the greatest down cycle we’ve
ever seen? My answer is simple: we have no choice but to assume that this isn’t the
end, but just another cycle to take advantage of.

I must admit it: I say that primarily because it is the only viable position. Here are
my reasons:

• It’s impossible to assign a high enough probability to the meltdown scenario to justify
acting on it.

• Even if you did, there isn’t much you could do about it.*

• The things you might do if convinced of a meltdown would turn out to be disastrous
if the meltdown didn’t occur.

Page 5

• Most of the time, the end of the world doesn’t happen. The rumored collapses due to
Black Monday in 1987 and Long-Term Capital Management in 1998 turned out to be
just that.
* -- Money has to be someplace; where would you put yours? If you put it in T-bills,
what purchasing power would be accorded the dollars in which they’re denominated? If
the government’s finances collapsed, what good would your dollars be, anyway? What
depository wouldn’t be in danger? If you and many others decided to put billions into
gold, what price would you have to pay for it? Where would you store it, and how would
you pay for the truck to move it? How would you spend it to buy the things you need?
What would people pay you for your gold, and what would they pay you with? And what
if you bought credit insurance on all of your holdings: who would be able to make good
on your claims?

No, I don’t see any viable way to plan for the end of the world. I don’t know any
more than anyone else about its probability, but I see no use in panicking.

I think the outlook has to be viewed as binary: will the world end or won’t it? If you
can’t say yes, you have to say no and act accordingly. In particular, saying it will
end would lead to inaction, while saying it’s not going to will permit us to do the
things that always have worked in the past.

We will invest on the assumption that it will go on, that companies will make money,
that they’ll have value, and that buying claims on them at low prices will work in
the long run. What alternative is there?

What Kind of Future Do We Face?
Of course, even assuming there will be a recovery, we have to think about what it will
look like. As I wrote in “Doesn’t Make Sense,” we aren’t counting on a “V.” We will
continue to emphasize companies that we feel serve basic economic functions and can do
relatively well even in bad times. Many elements in the economy are being damaged,
especially confidence, and they may take a relatively long time to recover. In particular,
the mechanism for providing capital is in great disrepair, and less credit certainly means a
slower recovery and less growth.

The financial institutions deserve a special mention. If there’s ever been a sector that’s
down-and-out, this is probably it. Nevertheless, Oaktree generally demands more
transparency in order to invest than most of them provide. It can seem almost impossible
to ascertain their condition through due diligence, and absolutely impossible without
access to their books. For example, possible buyers probably found the risks at Lehman

Brothers to be unanalyzable. As The Wall Street Journal said on Tuesday, Even understanding Lehman’s current trading positions was tough.
Lehman’s roster of interest-rate swaps (a type of derivative investment)
ran about two million strong . . .

What kind of effort would it require to understand the significance of two million
derivatives positions: are they thoroughly hedged, or bullish or bearish on
balance? And what about Lehman’s millions of other derivatives and complex
securities? This opacity, combined with heavy leverage, reliance on short-term
funds, liquidity and conscious risk taking, is the reason why a loss of confidence
is conceivable at any financial institution in times of panic.

What will the Wall Street of the future look like? We read – and I don’t doubt –
that for at least a while it will be smaller, less leveraged, less profitable, and more
highly regulated. But I also think it will be less competitive and less risky.

In the course of my career, Wall Street went from being (1) brokers handling
riskless trades for commission to (2) dealers buying and selling inventory for a
spread to (3) block traders purchasing large amounts of stock when market
liquidity was inadequate to (4) proprietary traders risking their own capital in
pursuit of profit for the house. Backing down this progression wouldn’t be the
worst thing in the world.

What Will Start the Recovery?
Eventually, someone will walk out of the crowd and take advantage of the lows.
He may start an investment bank unburdened with a legacy of losing positions.

Or a bond insurer like Warren Buffett did when MBIA and Ambac became
impaired. The cause of the recovery can’t be predicted. There may not even
be a visible one. Maybe things will just get so cheap that they can’t stay
down. (In ancient history – November 2001 – I wrote “You Can’t Predict; You
Can Prepare,” with a thorough description of how cycles happen, based on energy
all their own. It might be worth digging up.)

I like to point out that, even in retrospect, no one can say what started the collapse
of the tech stock bubble in 2000. But it did start . . . just, I think, because stock
prices rose far too high. That works in reverse, too.

In March, in “The Tide Goes Out,” I mentioned the three stages of a bull market,
a notion I’ve been carrying around in my head for about 35 years:

• the first, when a few forward-looking people begin to believe things will get better,

• the second, when most investors realize improvement is actually underway, and

• the third, when everyone’s sure things will get better forever.
Page 7

As we all know, buying during the first stage can be highly profitable, while buying
during the last euphoric stage usually leads to disaster.

Then I went on to create the converse of the above, the three stages of a bear market:

• the first, when just a few prudent investors recognize that, despite the prevailing
bullishness, things won’t always be rosy,

• the second, when most investors recognize things are deteriorating, and

• the third, when everyone’s convinced things can only get worse.

In the final stage, you can buy assets at prices that reflect little or no optimism.

There can be no doubt that we are in the third stage with regard to many financial
institutions. Not necessarily at the bottom, but in a serious period of unremitting
pessimism. No one seems able to imagine how the current vicious circle will
be interrupted. But I think we must assume it will be.

It must be noted that, just like two years ago, people are accepting as true
something that has never held true before. Then, it was the proposition that
massively levered balance sheets had been rendered safe by the miracle of
financial engineering. Today, it’s the non-viability of the essential financial
sector and its greatest institutions.

Everyone was happy to buy 18-24-36 months ago, when the horizon was
cloudless and asset prices were sky-high. Now, with heretofore unimaginable
risks on the table and priced in, it’s appropriate to sniff around for bargains: the
babies that are being thrown out with the bath water. We’re on the case.
September 19, 2008

Valuecap's Holdings

Wednesday, October 22, 2008 0 Comments
This information is from Adosco, our regular bursa chatter.

Valuecap's Holdings:

UAC Bhd 3,222,700 4.33 %

Anway(M) Holdings Bhd 6,958,100 4.23 %

MBM Resources Bhd 10,010,200 4.14 %

Hume Industries Bhd 6,596,400 3.45 %

PPB Group Bhd 40,452,900 3.41 %

IOI Property Bhd 28,267,500 3.4%

KLCC Property Holdings Bhd 30,957,800 3.31 %

Petronas Dagangan Bhd 32,436,400 3.27 %

YTL Cement bhd 14,955,092 3.05 %

Uchi Technologies Bhd 11,318,200 3.03 %

Chintek Plantations Bhd 2,646,000 2.9 %

United Plantations Bhd 5,975,800 2.87 %

Star Publications (M) Bhd 21,148,500 2.86 %

JTI International Bhd 7,144,400 2.73 %

Boustead Properties Bhd 6,672,150 261 %

Bintulu Port Holdings Bhd 10,121,100 2.53 %

Shell Refining Company Bhd 7,589,300 2.53 %

British American Tobacco Bhd 6,505,200 2.28 %

Axis REIT 5,400,000 2.11 %

Quill Capital Trust 4,302,000 1.1%

Tuesday, October 21, 2008


Composite Index Daily Technical Analysis 20/10/2008 By Zhuge Liang

As mentioned in last week's analysis, the KLCI is still volatile (as indicated by A, soon after opening, the KLCI started falling, and broke below the 900 mark by margin. However, the KLCI managed to rebound and close above the 900 mark, and the support for the KLCI is at 888.28 Fibonacci Retracement and the 900 psychological level, while the resistance is at 953.5 Fibonacci Retracement.

As shown on the chart, the Bollinger Bands Width contracted 7%, suggesting that the KLCI is likely to consolidate from now in the Bollinger Bands Width should continue to contract. But still, if the KLCI should regain its strength, it must first take out the Bollinger Middle Band dynamic resistance.

As indicated by B, total market volume increased 1.3%, suggesting that the overall market participation is still strong. Generally,if volume should continue to stay above the 40-day VMA level, there is a chance for the KLCI to regain some position as the the higher volume means some sufficient buying to absorb the T+3 selling. However, the major factor that affect the KLCI performance is still the global markets performance.

As circled at C, the Stochastic rebounded after breaking below 10% (over-sold region), and therefore, this suggests a chance for a technical rebound. If the Stochastic should break above 30% level, it would be the signal suggesting a beginning of a technical rebound. However, this does not means a short term strength for the KLCI yet, for if the KLCI short term movement was bullish, the Stochastic should remain above the 70% level.

综合指数 2008年 10月 20日

如上周提到般,综合指数继续着动荡的走势(参考箭头A),综指在开市后迅速下跌,一度跌破900点的关口。无论如何综指在888.28点的水平回弹,综指最终以909.51点闭市,按日微扬4.28点或0.5%。综指当前的支持水平是900点的心理支持水平,阻力水平则是953.5点的胜图自动费氏线。
如图所示,布林频带(Bollinger Band)收窄7%,所以综指有从之前的跌势站稳下来的迹象。若布林频带接下来继续收窄的话,那综指将有望暂时停止下跌的趋势。惟若综指要真正的止跌的话,那综指就得先上扬突破布林中频带(Bollinger Middle Band),因为这是综指当前的动态阻力线。
如图中箭头B所示,综指的成交量稍微增加1.3%,这显示市场的交投量保持活跃。因为市场陆续的出现T+3交割日的卖压继续的获得新的买盘吸纳,这对综指继续的转强是有利的。无论如何,综指接下来是否能真的避开进一步下跌则要视各种客观因素及国际市场的影响。
如图中C圈所示,随机指标(Stochastic)在跌至10%以下的水平后,出现短期超卖的讯号(参考上周的分析),所以随机指标周一上扬突破10%的水平,这显示综指在超卖后出现技术回弹。若随机指标接下来能上扬突破30%的话,这技术反弹的讯号将能获得确认。至于综指的短期走势是否能出现上扬的格局就要等待随机指标上扬突破70%的水平才能获得确认了。

Friday, October 17, 2008

BY Zhuge Liang

KNM is a war zone with bears mauling it's prices from a semi-bluechip to a pennystock & hitting limit down yesterday b4 being rescued in the nick of time from oblivion. KNM traders were being eaten alive until someone or something came to the rescue.

KNM Chart (below)

Who is THOR?
In Norse mythology, THOR was the god of war, thunder and strength, and son of Odin. THOR destroyed the enemies of the gods with his magic hammer. It was he who chased away the frosts and called gentle winds and warm spring rains to release the earth from its bondage of ice and snow.


THE (THOR'S) HAMMER .... a technical candlestick icon
A price pattern in candlestick charting that occurs when a security trades significantly lower than its opening, but rallies later in the day to close either above or close to its opening price. This pattern forms a HAMMER-shaped candlestick.

A HAMMER occurs after a security has been declining, possibly suggesting the market / stock is attempting to determine a bottom.

NOTE : The signal does not mean bullish investors have taken full control of a security, it simply indicates that the bulls are strengthening

HAPPY TRADING & GOODLUCK2ALL

Thursday, October 16, 2008


Interpreting Volume for the Futures Market By Zhuge Liang

Although many traders know how to use volume in their technical analysis of stocks, interpreting volume in the context of the futures market may require more understanding: considerably less research has been conducted on the volume of futures than that of stocks. Here we take a general look at some of the things you should know for looking at volume in the futures market.

The Beginning and End of the Day
It should be noted that volume is expected to be clustered on both ends of the trading day. In the morning, orders are entered into the market early as traders are reacting to overnight news and events as well as the previous day's data that is calculated and analyzed after the close. The end of the day is active due to traders juggling for position based on today's price movements. Closing price is typically the most dependable value of the day.

Chart Patterns
The volume of intraday trading displays typical chart patterns, such as a rounded bottom formation demonstrating lowest volume in the late morning when the traders take their breaks. The patterns of individual issues, however, may differ from these patterns. European currencies, for example, show more sustained high volume through late morning due to the prevalence of European traders in the markets at that time. To account for such patterns, compare today's 30-minute volume for a specific time period with the previous average volume for the same period.

Some rules of thumb for interpreting changes in volume and open interest in futures market are as follows:


:
1. A rising volume and a rising open interest are confirmation of a trend.
2. A rising volume and a falling open interest suggest position liquidation.
3. A falling volume and a rising open interest point to a period of slow accumulation.
4. A falling volume and a falling open interest depict a congestion phase.


Volume and open interest can be used in a practical sense to guide one's trades as follows:


1. Open interest increases during a period of an exhibited trend.
2. During the accumulation phase, volume may decline while open interest builds, but volume occasionally spikes.
3. Rising prices and a declining volume or open interest indicate a pending change of direction.


These rules, however, have exceptions, especially on days or at times when volume is expected to differ from the "norm". For example, volume is usually lighter on the first day of the week, on the day before a holiday, and during the entire quarterly period. Also volume may actually be heavier on Fridays and Mondays during a trending market. Liquidation of positions often occurs before the weekend, with positions being re-entered on the first day of the week. Finally, volume is heavier on a triple witching day, when stock-index futures, stock-index options and stock options all expire on the same day.

Conclusion
Volume and open interest are integral measures to guide one's trading decision on the futures markets, but as always, these indicators should be considered in relation to extraneous market events.

Wednesday, October 15, 2008


Composite Index Daily Technical Analysis 14/10/2008 By Zhuge Liang

Leading by the Dow Jones Industrial Averages rebounding more than 11%, the Asian Market closed higher, especially the Nikkie 225 Index, closing 14.15% higher. These has attracted some buying on local blue chips, and therefore, the KLCI opened gap up, closing 15.30 points higher.

As shown on the chart, the KLCI pull-back after the over-sold condition, and therefore, the first target for the KLCI is at the Bollinger Middle Band dynamic resistance. Together with the Bollinger Middle Band, the Fibonacci Retracement (23.6% Retracement) is also the resistance for the KLCI.

In addition, the Bollinger Bands Width contracted 3%, suggesting a consolidation signal for the KLCI. Nevertheless, the KLCI must first break above the Bollinger Middle Band in order to break away from the downside biased movement. Or else, any rebound below the Bollinger Middle Band would only be considered as technical rebound.

As indicated by B, total market volume increased 12.3% and stays above the 40-day VMA level. If the volume should remain above 40-day VMA level, it would definitely be a positive element for the KLCI, if the KLCI should attempt to break its resistance.

As circled at C, the Stochastic breaks above 30%, suggesting a beginning of a short term technical rebound. The technical rebound is likely to continue until the Stochastic should break below 30% level again.

综合指数 2008年 10月 14日
在美国道琼斯指数带领反弹暴涨11.1%下,亚太股市也纷纷报捷,日经指数涨幅更超越了道琼斯,达14..15%。由于市场受到正面的刺激,投资者纷纷进场扯购蓝筹股,这也使到我国综合指数在这影响下开市上扬跳空,使到图表上出现了一个缺口(Gap)。

如图所示,由于综指也继续的受到布林频带拉回效应(Pull Back Effect)的牵引(参考上周的分析),所以综指继续向布林中频带(Bollinger Middle Band)这反弹目标迈进。无论如何,布林中频带将是综指的动态阻力水平,在加上这也是23.6%的胜图自动费氏线阻力水平,所以综指意料在布林中频带将受到一度的阻力。

另一方面,布林频带收窄3%,这显示综指正从之前的跌势复苏过来,惟综指是必须先上扬突破布林中频带,那综指才有望出现转强的确认讯号,反之任何上扬只能算是纯技术反弹而已。

如图中箭头B所示,由于投资者纷纷被市场的反弹吸引而进场,所以成交量进一步扬升12.3%,继续的维持在40天成交量移动平均线(VMA)以上,这也表示市场继续的活跃,这对综指后市转强是有利的。

如图中C圈所示,随机指标(Stochastic)上扬突破了30%的水平,这表示综指的短期走势出现了技术反弹。通常这技术反弹将继续的维持下去,直到随机指标再度跌破30%为止。

Tuesday, October 14, 2008

True Blue Economist

Tuesday, October 14, 2008 0 Comments

True Blue Economist by Zhuge Liang

A mathematician, an accountant and an economist apply for the same job.

The interviewer calls in the mathematician and asks "What do two plus two equal?" The mathematician replies "Four." The interviewer asks "Four, exactly?" The mathematician looks at the interviewer incredulously and says "Yes, four, exactly."

Then the interviewer calls in the accountant and asks the same question "What do two plus two equal?" The accountant says "On average, four - give or take ten percent, but on average, four."

Then the interviewer calls in the economist and poses the same question "What do two plus two equal?" The economist gets up, locks the door, closes the shade, sits down next to the interviewer and says "What do you want it to equal?"

Monday, October 13, 2008

TECHNIMENTALIST

Monday, October 13, 2008 0 Comments

TECHNIMENTALISTS - A hybrid of Technicians & Fundamentalists? By Zhuge Liang

Market participants can be divided into three camps - the fundamentalist, the technician and a strange but rare hybrid between the two called the technimentalist. Let's take a look at how the three are different and why the last group has a distinct strategic advantage over the other two.

When it comes to money, everyone has an opinion. This is one reason why few so-called experts can ever agree on what to do with it. This is true even when they are from the same school of thought. Have you ever heard two economists agree on what the economy will do next? Try asking two analysts from the same brokerage firm which company is the best investment. Odds are high that their answers won't be the same.

So it's no surprise that when fundamental and technical analysts get together, the end is always the same, regardless of how long they discuss the methodology for making money in the market. At best they cordially agree to disagree.

Fundamental Versus Technical
Fundamentalists argue that the best way to invest is to research exhaustively a company from stem to stern, carefully dissecting annual statements, determine top and bottom line growth for the last umpteen years, compare price to earnings and a whole host of other ratios, interview management, study markets and the competition and then, and only then, can you know if the company is a buy or sell. For fundamentalists, determining what a company will be worth in the future by looking at its stock chart is like trying to drive a motorcycle in traffic while facing backwards. They say price gives you no idea where the stock is going, only where it's been.

Technicians, on the other hand, would argue that putting a company under a fiscal microscope is a complete waste of time. By the time you have access to the data, the stock has already reacted. And how can you guarantee that the data are accurate?

There is some convincing evidence for the technical analyst's argument. Look at WorldCom or Enron, for example. The poor investors who relied on financial disclosures from those companies saw stock portfolios decimated. But the market knew: by the time disclosures of financial misfeasance were made public, stock prices in both companies had already plummeted. Technicians only have to look at a stock chart to know what to do.

Marvelous Match ?Technimental Analysis
It's a match made in heaven for the technimentalist, who understands that there are fundamentals but that the market's reactions depend on the emotions of fear and greed. The technimentalist also realizes that the individual will likely never have access to all the facts in time to react before the market. Nor can he or she predict future market sentiment or the price swings that it causes. For this reason, the technimentalist understands that stock price is the best indicator of all. Covering the bases, fundamental analysis tells this hybrid investor what to buy or sell, and technical analysis to tells him or her when.

The Discipline of Technimental Analysis
No one would argue against doing your homework on a company before investing. But technimentalists believe that more important than getting tied up on past performance numbers, financial reports or corporate structure is an examination of the trends.

Are corporate revenues declining, stable or increasing? How effectively is the company competing? Is it gaining market share or losing it? Is the company experiencing growth and is that growth from top-line expansion (selling more product on increasing margins) or bottom-line cuts (laying off workers, cutting expenses or selling assets)? A company can lay off workers and cut expenses for only so long before its ability to compete is seriously diminished.

Another factor to examine is the activity of corporate insiders. If insiders such as directors and executives or institutions are selling their stock like there is no tomorrow, it is for a reason: they may believe that the stock is overpriced or they may be responding to other deep-rooted problems. Why should you buy stock in the company if those closely associated with it are selling large blocks of it? On the other hand, if insiders suddenly start to buy or are increasing holdings, it could indicate that corporate fortunes are improving or a promising new technology or product is having a positive effect on the bottom line.

The next step is to examine the charts. Have you ever heard an analyst sing the praises of a company only to see that it has a chart that looks like a ski slope into oblivion? It might have an attractive price-to-earnings ratio and a healthy balance sheet, but do you want to invest your hard-earned money on a bet that the stock will turn around immediately after you jump in? Traders call that practice catching a falling knife for a reason. It is a sad but true fact that thousands of investors will buy a stock based on such a recommendation without taking so much as a glance at the chart.

One of the main tenets of technical analysis is that stocks move in trends. Another is that a trend will continue until an equal or greater opposing force acts on the stock. An unexpected change in earnings, the loss of a large contract or any number of countless reasons could be a force significant enough to change investor sentiment. Betting on a trend reversal is far riskier than betting that it will continue.

There are countless other examples of stocks that dropped even though analysts presented sound fundamental arguments to buy. For those listening to the valuation arguments, Enron became more attractive as its price plummeted: the more its price decreased, the more attractive its multiples became. So many continued to buy it. And what is it worth today? Zero, zilch, nada.

Conclusion - Putting It All Together
While investors with any experience would never buy a stock without researching the fundamentals of the company, many will completely ignore the technicals. But relying solely on fundamentals to buy or sell ignores two major market forces: the emotions of fear and greed.

By studying the fundamentals - such as the direction of revenues, margins, insider sales and other key factors-you can determine what companies to buy or sell. But by following the direction and trend of the stock chart to monitor sentiment and by waiting for all to agree, you can determine exactly when to make your move.


Quote:
Finally, fundamentalists are longer-term
investors while technicians are generally short to medium-term traders. In the
eyes of each, the other could not be more wrong. But if one is east and the
other west, shall never the twain meet?

Friday, October 10, 2008


By Zhuge Liang

As indicated by A, the KLCI lost 1.30 points, forming a narrow candlestick, which is a sign of a decelerating of its downtrend; thus, a chance of a consolidation for the KLCI. Support for the KLCI is at 960 Fibonacci Retracement while the resistance is at 1008 Fibonacci Retracement (23.6% Fibo).

As shown on the chart, the Bollinger Bands Width expanded 20%. If compared with the previous expansion rate of 60%, Thursday's expansion is relatively smaller. If the Bollinger Bands Width should starts to contract, it would be a signal suggesting a consolidation for the KLCI, and the KLCI is likely to rebound and re-test the Bollinger Middle Band, which is usually the first target of a technical rebound.

However, the Bollinger Middle Band is also the dynamic resistance for the KLCI. In other words, breaking above the Bollinger Middle Band is not going to be easy, unless the KLCI is supported with positive sentiment. If the KLCI should break above the Bollinger Middle Band successfully, it is possible to end its downtrend.

As indicated by B, total market volume declined 24.5%, but still above the 40-day VMA level. This suggests that the overall market is still widely participated, and if volume should remain above the 40-day VMA level as the KLCI rebound, it would help to lift the market confidence, thus a crucial element for the KLCI to break above the downtrend.

As circled at C, the Stochastic is now below 30% level, which is the short term bearish region. As long as the Stochastic is still below 30%, the short term bearish movement for the KLCI is expected to continue.

HAPPY TRADING FOLKS

综合指数 2008年 10月 09日

如图中箭头A所示,综合指数稍微下滑1.30点,形成了一个小阴阳烛(Small Candlestick),这是综指跌势有缓和下来的迹象。综指当前的支持水平是960点的胜图自动费氏线,阻力水平则是1008点的23.6%胜图自动费氏线。

如图所示,布林频带(Bollinger Band)打开的幅度从周三的60%减低至20%,这表示综指的跌势有停下来的迹象。若布林频带接下来打开的幅度继续减低甚至开始出现收窄的话,那综指将有望出现技术反弹。通常当综指出现技术反弹时,综指反弹的第一个目标将是布林中频带(Bollinger Middle Band),不过由于布林中频带是综指的动态阻力,所以综指将在布林中频带遇到阻力。

换句话说,综指是不容易突破布林中频带的,除非综指获得强而有力的扶持。不过若综指能上扬突破布林中频带的话,那综指将有望摆脱跌势而转强。

如图中箭头B所示,马股成交量减低24..5%,惟成交量还是成功的维持在40天成交量移动平均线(VMA)以上,这表示整体市场还是保持相当活跃。若成交量能继续的维持在40天平均值以上的话,那综指接下来转强或反弹的机会也将更浓厚。

如图中C圈所示,随机指标(Stochastic)处于30%以下,这表示综指当前的短期走势是处于下跌中,直到随机指标上扬突破30%为止。

Thursday, October 9, 2008


In Bursa, the bulls and bears are in a constant struggle. If you haven't heard of these terms already, you undoubtedly will as you begin to invest.

The Bulls
A bull market is when everything in the economy is great, people are finding jobs, gross domestic product (GDP) is growing, and stocks are rising. Things are just plain rosy! Picking stocks during a bull market is easier because everything is going up. Bull markets cannot last forever though, and sometimes they can lead to dangerous situations if stocks become overvalued. If a person is optimistic and believes that stocks will go up, he or she is called a "bull" and is said to have a "bullish outlook".

The Bears
A bear market is when the economy is bad, recession is looming and stock prices are falling. Bear markets make it tough for investors to pick profitable stocks. One solution to this is to make money when stocks are falling using a technique called short selling. Another strategy is to wait on the sidelines until you feel that the bear market is nearing its end, only starting to buy in anticipation of a bull market. If a person is pessimistic, believing that stocks are going to drop, he or she is called a "bear" and said to have a "bearish outlook".

The Other Animals on the Farm - Sheeps, Chickens and Pigs

The Sheeps
The sheep is an investor who lacks a focused trading strategy and trades on emotion and the suggestions of others, including friends, family and financial gurus. This type of investor often makes rash investments without reviewing their financial viability. The behavior of sheep contrasts with that of bulls and bears, who have focused views about the market.

Sheep-like investors are often the last to get in on a major market move, such as the tech boom of the late '90s, because they base their investments on what is being talked about the most. Many experts believe that sheep-like investors are the most likely to sustain investment losses because they have no clear investment strategy

The Chickens
Chickens are afraid to lose anything. Their fear overrides their need to make profits and so they turn only to money-market securities or get out of the markets entirely. While it's true that you should never invest in something over which you lose sleep, you are also guaranteed never to see any return if you avoid the market completely and never take any risk,

The Pigs
Pigs are high-risk investors looking for the one big score in a short period of time. Pigs buy on hot tips and invest in companies without doing their due diligence. They get impatient, greedy, and emotional about their investments, and they are drawn to high-risk securities without putting in the proper time or money to learn about these investment vehicles. Professional traders love the pigs, as it's often from their losses that the bulls and bears reap their profits.

What Type of Investor Will You Be?
There are plenty of different investment styles and strategies out there. Even though the bulls and bears are constantly at odds, they can both make money with the changing cycles in the market. Even the chickens see some returns, though not a lot. The one loser in this picture is the pig.

Make sure you don't get into the market before you are ready. Be conservative and never invest in anything you do not understand. Before you jump in without the right knowledge, think about this old stock market saying:

"Bulls make money, bears make money, but pigs just get slaughtered!"

OLD MAN DONALD HAD A FARM ....EYAHH EYAHH OH !

Wednesday, October 8, 2008

Composite Index 07/10/2008

Wednesday, October 08, 2008 0 Comments

Composite Index 07/10/2008

As indicated by A, the the KLCI opened lower on Tuesday as global markets closed lower. However, the KLCI managed to rebound from the Bollinger lower band, ended 0.39 points higher. Resistance for the KLCI remains at the psychological 1000 & 1011 Fibonacci Retracement while the support is still at 963.29 Fibo.

As shown on the chart above, the Bollinger Bands Width contracted 11%, suggesting the KLCI is still likely to consolidate, which is a best scenario for the KLCI from the technical analysis stand point. If the Bollinger Bands Width should continue to contract, the KLCI is expected to consolidate further while preparing for a new movement.
Nevertheless, with the KLCI situated below the Bollinger Middle Band, the immediate outlook for the KLCI is still cautiously bearish biased. The Bollinger Middle Band is still the dynamic resistance for the KLCI.

As indicated by B, total market volume increased 10.2%, with volume staying above the 40-day VMA level. If the KLCI should continue to rebound with volume above the 40-day VMA level, it would be a positive sign for the KLCI, and the KLCI would have a better chance to take out the resistance lines.

As circled at C, the MACD histogram is showing a rounding top, suggesting a short term weakening movement for the KLCI. But still, the priority of the analysis is still the primary indicator (Bollinger Bands) for during a consolidation, secondary indicators signal are usually less reliable.

HAPPY TRADING FOLKS & GOODLUCK2U

Zhuge Liang

Tuesday, October 7, 2008


Composite Index Daily Technical Analysis 06/10/2008 By Zhuge Liang
As indicated by A, the Bollinger Bands Width expanded 10%, with the KLCI situated below the Bollinger Middle Band, closing 19.86 or 2% lower on Monday, and breaking below the 1000 psychological mark. Nevertheless, the KLCI is now temporary supported by the Bollinger lower band. Support for the KLCI is at 963.29 Fibonacci Retracement while the resistance are at the Bollinger Middle Band followed by the 1011 Fibo.

As shown on the chart, the Bollinger Bands Width only started to expands, and it is considered as an early stage of the signal. If the KLCI should rebound in the near term, the consolidation is likely to continue, thus reducing the risk of continuation of the downtrend. However, with negative sentiment across the globe, the KLCI is likely to be affected by the regional markets.

As indicated by B, total market volume increased 26% on Monday, and breaking above the 40-day VMA level. This suggests some bargain buying activities as the KLCI is falling. However, as the KLCI is still falling, these bargain are likely to be speculative.

As circled at C, the Stochastic fall from 70% level to below 10% level, again, this signal might be too sensitive as the KLCI is basically still consolidating. Therefore, the priority of the analysis should still be on the primary indicator like the Bollinger Bands. Nevertheless, if the Stochastic should remain below 30% level, the short term market movement for the KLCI is likely be bearish biased.

To sum up, the expansion of the Bollinger Bands Width is suggesting a beginning of a new movement, and the KLCI staying below the Bollinger Middle Band is generally a negative signal. If the Bollinger Bands Width should expands further, the risk of further downside movement would increased.

Monday, October 6, 2008


KENCANA PETROLEUM (5122)
Before proceeding any further, ZL reminds readers this KENCANA article is just another case study - nothing more nothing less. All technicalities are in accordance with performances as seen in charts with little regards for mkt sentiments and fundamentals. Read with caution and do not take everything for granted. Pls consult yout personal remisier for more opinions & infos. Tq.

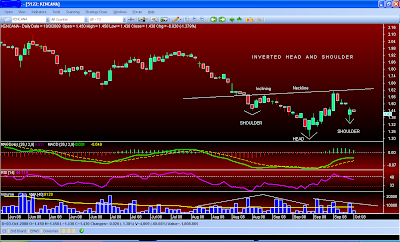
INVERTED HEAD & SHOULDER
This is an illustration/s of an early KENCANA Inverted Head & Shoulder pattern. Unless a sudden big bull candle appear out of nowhere (which is quite unlikely), there are quite a few more candles to go b4 a completion or if there will be any completion at all with present mkt sentiments, a total breakdown is not all impossible. But if, touch wood, this H&S gets half a chance to complete itself, the early bird will catch the worm and that would be quite a catch.

INVERTED H&S Chart
Picture perfect with rising or inclining neckline - in total contrast with ZL's recent KLCI Head & Shoulder that emphasized the continuation of KLCI downtrend progression upon a broken neckline.

Hopefully this KENCANA Inverted Head & Shoulder perform opposite what the KLCI H&S did. It's advantage was a weak mkt and declining volume and for this HENCANA Inverted H&S to perform as characteristically, added volume will be crucial + better mkt sentiments & lots of luck.

INVERTED H&S PROPERTIES AND TARGETS
With inverted head and shoulders the neckline is drawn through the highest points of the two intervening peaks. A downward sloping neckline signals continuing weakness and is less reliable as a reversal signal. Therefore, an inclining or rising neckline depicts continuous progress and is more reliable as a U-turner or reversal pattern.
The extent of the breakout move can be estimated by measuring from the top of the middle trough up to the neckline. This target is then projected upwards from the point of breakout.

INVERTED H&S VOLUME CONFIRMATIONS
1. The price falls to a trough and then rises.
2. The price falls below the former trough and then rises again.
3. Finally, the price falls again, but not as far as the second trough

Once the final trough is made, the price heads upward toward the resistance found near the top of the previous troughs. Investors typically enter into a long position when the price rises above the resistance of the neckline. The first and third trough are considered shoulders, and the second peak forms the head

The extent of the breakout move can be estimated by measuring from the top of the middle trough up to the neckline. This target is then projected upwards from the point of breakout. ( REFER GRAPHIC CHART ATTACHED )

RESEARCH & FUNDAMENTALS
Attached 2 PDF files for your perusal.

1. CIMB Research KENCANA pdf

2. AM Research KENCANA pdf

***(Ah Seng pls attach pdf files as above here)

NOTE : Zoom in to read some commentaries in respective charts

HAPPY TRADING & GOODLUCK FOLKS

Zhuge Liang

Thursday, October 2, 2008


KLCI 30092008 Technical Analysis
Due to the biggest daily fall of the Dow Jones Industrial Index, the KLCI opened gap down below the Bollinger Lower Band. Soon, the KLCI began to rebound and at the close, it had filled up the opening gap as indicated by A. The KLCI attempted to test the Bollinger Middle Band on Tuesday, but again failed. Therefore, the Bollinger Middle Band is still the dynamic resistance for the KLCI.

Since the KLCI break below the Bollinger Middle Band, the immediate outlook for the KLCI is now turning negative. This is because if the Bollinger Bands Width should re-expands with the KLCI below the Bollinger Middle Band, it would be a bearish movement signal for the KLCI, and the Bollinger Middle Band would continue serving as the dynamic resistance. However, with the Bollinger Bands Width still contracting, the KLCI is expected to continue its consolidation.

As indicated by B, total market volume increased 43.3% on Tuesday, suggesting some bargain buying activities, which caused the KLCI to rebound. If the KLCI should continue to rebound with the volume maintaining above the 40-day VMA level, the KLCI would have a better chance to regain some lost ground. However, if volume should fail to sustain above the 40-day VMA level, the weaker market sentiment is expected to continue.

As circled at C, the MACD histogram is still rising while no rounding top is sighted yet. If the MACD histogram should form a rounding top, it would be a signal suggesting a weakening short term movement for the KLCI.

COMPOSITE INDEX LONGTERM
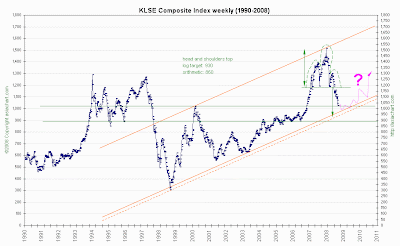
As can be noticed from the KLCI longterm chart, KLCI 1000 support looking solid. Twice the defending bulls pushed the marauding bears back across the critical 1000 boundary - first onslaught when the bears pressed the CI to as low as 963.29 on 18 Sep 08 days of Lehman Bros & Merill Lynch financial bankruptcy and 2nd assault 30 Sep 08 when the US Govt 700 billion Dollar bailout proposal got torpedoed by Congress sinking the Dow with the single largest historical mother of all tumble. DJIA sank 777.68 pts on panic selling. The KLCI being coupled with the DJIA opened below the critical 1000 but rebounding strongly on bargain hunting. The bulls survived another fierce assault with some minor bruises and scratches. That was only 2 battles and u can bet your sweet ass the bears will attack again - and the defending bulls had better be prepared for the big one.

Over the LONG TERM chart, the bearish built up looks even more menacing by the day.

COMPOSITE INDEX H&S FORMATION
Notice the LEFT shoulder is much higher than the RIGHT shoulder of the KLCI longterm Head & Shoulder formation? This H&S is more compellingly visible with the 2 years CI daily chart. One of the major rule of thumb properties for a H&S formation is the potency of slanting left >>> right shoulders. This descending inclination is a disaster for long positions and as possibly close as a sure-win for short positions once a breakout occur.

The KLCI H&S formation descending breakout HANCUR the KLCI on the 02 Jul 2008 when the Neckline 1060 Support was taken out. Technically , 1064 was the critical mark but a few points was allocated for minor discrepancies when charting a 2 year duration. Not all trading software attributes are perfectly the same. That is plain bullsh*t.

IMPORTANT : Pay special attention to the GREEN Parallel Support Channels, there are 2, in the CI longer term chart. 1st horizontal GREEN Parallel had been broken . We are now surviving the inclining or rising GREEN Parallel Support. Once the bears overrun this ALAMO last stand .... CHAOS.

KCLI 920 predictors can then take their jamban predictions to the toilet and wipe their asses with it. A single 2 inch line drawn officially represents KLCI 2 yrs chart support? And ZL is suppose to accept such CI 920 challenge? Tak payah since ZL already saw that coming months ago albeit differently from a Royalty. Zhuge Liang let you win if that makes you feel any better. Now you can go back and scrub your sh*tpot happily Mr JambanED.

ZL already charted any possible upcoming scenarios including all possibilities, subjectives and even adjectives. Don't laugh guys, even maths are invoked during times of crisis and we are very close to ARMAGEDDON. Will it or won't it? WTF u looking at ZL for? Ask GOD lahhhh ..... I'm only a mortal chartist.

KLCI DAILY
Log Target : 910
Arithmatic : 830

KLCI WEEKLY
Log Target : 930
Arithmatic : 860

EWM CLOSING (EWM is Malaysian stock code in New York Stock Exchange - NYSE)
Log Target : 8 (Done)
Arithmatic : 7

The KLCI WEEKLY and EWM Closing charts are crystal clear & annotations readable - just zoom in if you don't hv Loh Fah reading glasses TA enthusiats should hv no problems disseminating the directions and numbers with just a glance at the respective trendlines.

HAPPY TRADING FOLKS

Zhuge Liang