

KENCANA PETROLEUM (5122)
Before proceeding any further, ZL reminds readers this KENCANA article is just another case study - nothing more nothing less. All technicalities are in accordance with performances as seen in charts with little regards for mkt sentiments and fundamentals. Read with caution and do not take everything for granted. Pls consult yout personal remisier for more opinions & infos. Tq.
INVERTED HEAD & SHOULDER
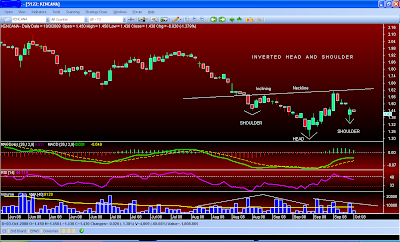
This is an illustration/s of an early KENCANA Inverted Head & Shoulder pattern. Unless a sudden big bull candle appear out of nowhere (which is quite unlikely), there are quite a few more candles to go b4 a completion or if there will be any completion at all with present mkt sentiments, a total breakdown is not all impossible. But if, touch wood, this H&S gets half a chance to complete itself, the early bird will catch the worm and that would be quite a catch.
INVERTED H&S Chart
Picture perfect with rising or inclining neckline - in total contrast with ZL's recent KLCI Head & Shoulder that emphasized the continuation of KLCI downtrend progression upon a broken neckline.
Hopefully this KENCANA Inverted Head & Shoulder perform opposite what the KLCI H&S did. It's advantage was a weak mkt and declining volume and for this HENCANA Inverted H&S to perform as characteristically, added volume will be crucial + better mkt sentiments & lots of luck.
INVERTED H&S PROPERTIES AND TARGETS
With inverted head and shoulders the neckline is drawn through the highest points of the two intervening peaks. A downward sloping neckline signals continuing weakness and is less reliable as a reversal signal. Therefore, an inclining or rising neckline depicts continuous progress and is more reliable as a U-turner or reversal pattern.
The extent of the breakout move can be estimated by measuring from the top of the middle trough up to the neckline. This target is then projected upwards from the point of breakout.
INVERTED H&S VOLUME CONFIRMATIONS
1. The price falls to a trough and then rises.
2. The price falls below the former trough and then rises again.
3. Finally, the price falls again, but not as far as the second trough
Once the final trough is made, the price heads upward toward the resistance found near the top of the previous troughs. Investors typically enter into a long position when the price rises above the resistance of the neckline. The first and third trough are considered shoulders, and the second peak forms the head
The extent of the breakout move can be estimated by measuring from the top of the middle trough up to the neckline. This target is then projected upwards from the point of breakout. ( REFER GRAPHIC CHART ATTACHED )
RESEARCH & FUNDAMENTALS
Attached 2 PDF files for your perusal.
1. CIMB Research KENCANA pdf
2. AM Research KENCANA pdf
***(Ah Seng pls attach pdf files as above here)
NOTE : Zoom in to read some commentaries in respective charts
HAPPY TRADING & GOODLUCK FOLKS
Zhuge Liang
.png)


No comments:
Post a Comment