

KLCI 30092008 Technical Analysis
Due to the biggest daily fall of the Dow Jones Industrial Index, the KLCI opened gap down below the Bollinger Lower Band. Soon, the KLCI began to rebound and at the close, it had filled up the opening gap as indicated by A. The KLCI attempted to test the Bollinger Middle Band on Tuesday, but again failed. Therefore, the Bollinger Middle Band is still the dynamic resistance for the KLCI.
Since the KLCI break below the Bollinger Middle Band, the immediate outlook for the KLCI is now turning negative. This is because if the Bollinger Bands Width should re-expands with the KLCI below the Bollinger Middle Band, it would be a bearish movement signal for the KLCI, and the Bollinger Middle Band would continue serving as the dynamic resistance. However, with the Bollinger Bands Width still contracting, the KLCI is expected to continue its consolidation.
As indicated by B, total market volume increased 43.3% on Tuesday, suggesting some bargain buying activities, which caused the KLCI to rebound. If the KLCI should continue to rebound with the volume maintaining above the 40-day VMA level, the KLCI would have a better chance to regain some lost ground. However, if volume should fail to sustain above the 40-day VMA level, the weaker market sentiment is expected to continue.
As circled at C, the MACD histogram is still rising while no rounding top is sighted yet. If the MACD histogram should form a rounding top, it would be a signal suggesting a weakening short term movement for the KLCI.
COMPOSITE INDEX LONGTERM
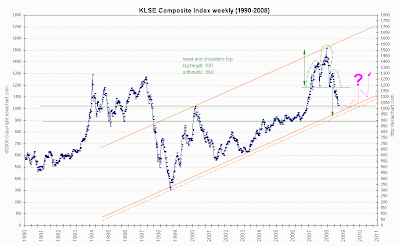
As can be noticed from the KLCI longterm chart, KLCI 1000 support looking solid. Twice the defending bulls pushed the marauding bears back across the critical 1000 boundary - first onslaught when the bears pressed the CI to as low as 963.29 on 18 Sep 08 days of Lehman Bros & Merill Lynch financial bankruptcy and 2nd assault 30 Sep 08 when the US Govt 700 billion Dollar bailout proposal got torpedoed by Congress sinking the Dow with the single largest historical mother of all tumble. DJIA sank 777.68 pts on panic selling. The KLCI being coupled with the DJIA opened below the critical 1000 but rebounding strongly on bargain hunting. The bulls survived another fierce assault with some minor bruises and scratches. That was only 2 battles and u can bet your sweet ass the bears will attack again - and the defending bulls had better be prepared for the big one.
Over the LONG TERM chart, the bearish built up looks even more menacing by the day.
COMPOSITE INDEX H&S FORMATION
Notice the LEFT shoulder is much higher than the RIGHT shoulder of the KLCI longterm Head & Shoulder formation? This H&S is more compellingly visible with the 2 years CI daily chart. One of the major rule of thumb properties for a H&S formation is the potency of slanting left >>> right shoulders. This descending inclination is a disaster for long positions and as possibly close as a sure-win for short positions once a breakout occur.
The KLCI H&S formation descending breakout HANCUR the KLCI on the 02 Jul 2008 when the Neckline 1060 Support was taken out. Technically , 1064 was the critical mark but a few points was allocated for minor discrepancies when charting a 2 year duration. Not all trading software attributes are perfectly the same. That is plain bullsh*t.
IMPORTANT : Pay special attention to the GREEN Parallel Support Channels, there are 2, in the CI longer term chart. 1st horizontal GREEN Parallel had been broken . We are now surviving the inclining or rising GREEN Parallel Support. Once the bears overrun this ALAMO last stand .... CHAOS.
KCLI 920 predictors can then take their jamban predictions to the toilet and wipe their asses with it. A single 2 inch line drawn officially represents KLCI 2 yrs chart support? And ZL is suppose to accept such CI 920 challenge? Tak payah since ZL already saw that coming months ago albeit differently from a Royalty. Zhuge Liang let you win if that makes you feel any better. Now you can go back and scrub your sh*tpot happily Mr JambanED.
ZL already charted any possible upcoming scenarios including all possibilities, subjectives and even adjectives. Don't laugh guys, even maths are invoked during times of crisis and we are very close to ARMAGEDDON. Will it or won't it? WTF u looking at ZL for? Ask GOD lahhhh ..... I'm only a mortal chartist.
KLCI DAILY
Log Target : 910
Arithmatic : 830
KLCI WEEKLY
Log Target : 930
Arithmatic : 860
EWM CLOSING (EWM is Malaysian stock code in New York Stock Exchange - NYSE)
Log Target : 8 (Done)
Arithmatic : 7
The KLCI WEEKLY and EWM Closing charts are crystal clear & annotations readable - just zoom in if you don't hv Loh Fah reading glasses TA enthusiats should hv no problems disseminating the directions and numbers with just a glance at the respective trendlines.
HAPPY TRADING FOLKS
Zhuge Liang
.png)


2 comments:
GOOD ANALYSIS. KEEP IT UP. YOU HAVE DONE A GREAT JOB.
Hi lee,
ZL will try his very best to keep things in perspective but as detailed as possible.
Pls be reminded that charting is SUBJECTIVE. The KLCI (in this case) has every reason without any warning to make chartist feels like a fool.
Nevertheless ZL gave it all he got albeit right or wrong.
This analysis cannot be any more worse than some #1 JambanED Blog bullshitter that detail the KLCI 920 with nothing but an old 2 inch crack in the crystalball bought somewhere along backlane of Petaling Street.
That is toilet paper charting 2 ZL ...hehehe
Post a Comment