.png)
Composite Index Daily Technical Analysis 09/01/2009 By Zhuge Liang
 As indicated by A, the KLCI rebounded on Friday, but still resisted by the 920 Fibonacci Retracement. Therefore, the 920 resistance is still intact while the 900 level is still the support level for the KLCI. Again, the Bollinger Middle Band is also the dynamic support for the KLCI.
As shown on the chart above, the Bollinger Bands Width only expanded 2%, which is rather insignificant; therefore, it is likely that the KLCI to continue its consolidation. Expansion of the Bollinger Bands Width has to be obvious in order to signal any direction for the KLCI.
As indicated by B, total market volume is still below the 40-day VMA level, suggesting that the overall market participation is low. Again, this is rather normal for the KLCI is at its consolidation stage. If the KLCI should resume its rally, total market volume has to break above the 40-day VMA level in order to confirm the rally.
As indicated by C, the Stochastic managed to return to above 70% level, and therefore, the short term bullish signal is still in place. Provided that the Stochastic could maintain above 70% level, the market movement for the short term is still bullish biased. In short, the KLCI is having its consolidation with lower volume, and the selling pressure is not extreme, therefore, as long as the KLCI is still supported with the Bollinger Middle Band, the immediate outlook is still positive.
综合指数 2009年 01月 09日
如图中箭头A所示,综合指数出现回弹,惟综指再度的在920点的胜图自动费氏线遇到阻力,所以920点再度的成为综指当前的阻力水平,综指目前的支持水平则是900点的胜图自动费氏线,由于这接近布林中频带(Bollinger Middle Band),所以预料支持力量将倍增。
如图所示,布林频带(Bollinger Band)打开的幅度维持在2%,这显示布林频带停止了收窄,所以综指也有望停止调整,无论如何,布林频带还是必须要开始明显的打开,那综指才有望再度出现上扬的趋势,惟综指是必须继续的维持在布林中频带以上。
如图中箭头B所示,成交量继续的处于40天成交量移动平均线(VMA),所以整体市场仍然算是处于一个调整巩固的格局里。若综指要真正的形成一个上扬趋势的话,那成交量是必须要上扬至40天平均值或以上的。
如图中箭头C所示,由于随机指标(Stochastic)再度回到70%以上的水平,这表示综指的短期走势再度回到短期上扬的格局。一般上,综指将有望再度的出现短期转强的走势,直到随机指标跌破70%为止。
总的来说,综指在下跌或调整时成交量偏低,这表示投资者并未慌张的抛售股票,只是一程度的套利活动,这显示综指仍然有转强的机会。
HAPPY INVESTING & GOODLUCK2ALL
XXXXXXXXXXXXXXXXXXXXXXXXXXXXXXXXXXXXXXXXXXXXXXXXXXXXXXXX
Random Charts
1. WCT
2. UEMLand
3. TWSCorp (MACD)
4. TWSCorp (DMI)
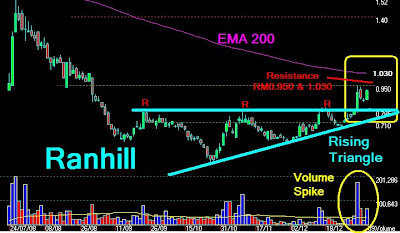
5. Ranhill


If you like the post, please subscribe to Bursa Chat. We will send you the latest post by Email
===> Click Subscribe to Bursa Chat by Email
BACK TO CHAT BOX
 As indicated by A, the KLCI rebounded on Friday, but still resisted by the 920 Fibonacci Retracement. Therefore, the 920 resistance is still intact while the 900 level is still the support level for the KLCI. Again, the Bollinger Middle Band is also the dynamic support for the KLCI.
As shown on the chart above, the Bollinger Bands Width only expanded 2%, which is rather insignificant; therefore, it is likely that the KLCI to continue its consolidation. Expansion of the Bollinger Bands Width has to be obvious in order to signal any direction for the KLCI.
As indicated by B, total market volume is still below the 40-day VMA level, suggesting that the overall market participation is low. Again, this is rather normal for the KLCI is at its consolidation stage. If the KLCI should resume its rally, total market volume has to break above the 40-day VMA level in order to confirm the rally.
As indicated by C, the Stochastic managed to return to above 70% level, and therefore, the short term bullish signal is still in place. Provided that the Stochastic could maintain above 70% level, the market movement for the short term is still bullish biased. In short, the KLCI is having its consolidation with lower volume, and the selling pressure is not extreme, therefore, as long as the KLCI is still supported with the Bollinger Middle Band, the immediate outlook is still positive.
综合指数 2009年 01月 09日
如图中箭头A所示,综合指数出现回弹,惟综指再度的在920点的胜图自动费氏线遇到阻力,所以920点再度的成为综指当前的阻力水平,综指目前的支持水平则是900点的胜图自动费氏线,由于这接近布林中频带(Bollinger Middle Band),所以预料支持力量将倍增。
如图所示,布林频带(Bollinger Band)打开的幅度维持在2%,这显示布林频带停止了收窄,所以综指也有望停止调整,无论如何,布林频带还是必须要开始明显的打开,那综指才有望再度出现上扬的趋势,惟综指是必须继续的维持在布林中频带以上。
如图中箭头B所示,成交量继续的处于40天成交量移动平均线(VMA),所以整体市场仍然算是处于一个调整巩固的格局里。若综指要真正的形成一个上扬趋势的话,那成交量是必须要上扬至40天平均值或以上的。
如图中箭头C所示,由于随机指标(Stochastic)再度回到70%以上的水平,这表示综指的短期走势再度回到短期上扬的格局。一般上,综指将有望再度的出现短期转强的走势,直到随机指标跌破70%为止。
总的来说,综指在下跌或调整时成交量偏低,这表示投资者并未慌张的抛售股票,只是一程度的套利活动,这显示综指仍然有转强的机会。
HAPPY INVESTING & GOODLUCK2ALL
XXXXXXXXXXXXXXXXXXXXXXXXXXXXXXXXXXXXXXXXXXXXXXXXXXXXXXXX
Random Charts
1. WCT
2. UEMLand
3. TWSCorp (MACD)
4. TWSCorp (DMI)
5. Ranhill


===> Click
Subscribe to Bursa Chat by EmailBACK TO CHAT BOX


No comments:
Post a Comment