Technical | Fundamental Analysis Discussion Stocks Listed In Bursa

Friday, July 31, 2009

The price of a stock is the result of a decision on the part of both a buyer and a seller. The buyer believes prices will go higher; the seller feels prices will decline. These decisions are represented by a trade at an exact price.

Once the buyer and seller make their trade, their influence in the market is spent — except for the opposite reaction they will ultimately have when they close the trade. Thus, there are two aspects to every trade: 1) each trade must ultimately have an opposite reaction on the market, and 2) the trade will influence other traders.

Each trader's reaction to price movements can be generalized into the reactions of three basic groups of traders who are always present in the market: 1) traders who have long positions; 2) those who hold short positions; and 3) those who have not taken a position but soon will. Traders in the third group have mixed views on the market's probable direction. Some are bullish while others are bearish, but a lack of positive conviction has kept them out of the market. Therefore, they also have no vested interest in the market's direction.

The impact of human nature on futures prices can perhaps best be seen by examining changing market psychology as a typical market moves through a complete cycle from price low to price low.

Classic price pattern
Assume prices trade within a relatively narrow trading range (between points A and B on the chart). Recognizing the sideways price movement, the "longs" might buy additional contracts if the price advances above the recent trading range. They may even enter stop orders to buy at B, to add to their position if they should get some confirmation the trend is higher. But by the same token, recognizing prices might decline below the recent trading range and move lower, they might also enter stop loss orders below the market at A to limit their loss.

The "shorts" have exactly the opposite reaction to the market. If the price advances above the recent trading range, many of them might enter stop loss orders to buy above point B to limit losses. But they, too, may add to their position if the price should decline below point A with orders to sell additional contracts on a stop below point A.


The third group is not in the market, but they are watching it for a signal either to go long or short. This group may have stop orders to buy above point B, because presumably the price trend would begin to indicate an upward bias if point B were penetrated. They may also have standing orders to sell below point A for converse reasons.

Assume the market advances to point C. If the trading range between points A and B has been relatively narrow and the time period of the lateral movement relatively long, the accumulated buy stops above the market could be quite numerous. Also, as the market breaks above point B, brokers contact their clients with the news, and this results in a stream of market orders. As this flurry of buyers becomes satisfied and profit-taking from previous long positions causes the market to dip from the high point of C to point D, another distinct attitude begins working in the market.

Part of the first group that went long between points A and B did not buy additional contracts as the market rallied to point C. Now they may be willing to add to their position "on a dip." Consequently, buy orders trickle in from these traders as the market drifts down.

The second group of traders with short positions established in the original trading range have now seen prices advance to point C, then decline to move back closer to the price at which they originally sold. If they did not cover their short positions on a buy stop above point B, they may be more than willing to "cover on any further dip" to minimize the loss.

Those not yet in the market will place price orders just below the market with the idea of "getting in on a dip."

The net effect of the rally from A to C is a psychological change in all three groups. The result is a different tone to the market, where some support could be expected from all three groups on dips. (Support on a chart is denned as the place where the buying of a futures contract is sufficient demand to halt a decline in prices.) As this support is strengthened by an increase in market orders and a raising of buy orders, the market once again advances toward point C. Then, as the market gathers momentum and rallies above point C toward point E, the psychology again changes subtly.

The first group of long traders may now have enough profit to pyramid additional contracts with their profits. In any case, as the market advances, their enthusiasm grows and they set their sights on higher price objectives. Psychologically, they have the market advantage.

The original group who sold short between A and B and who have not yet covered are all carrying increasing losses. Their general attitude is negative because they are losing money and confidence. Their hopes fade as their losses mount. Some of this group begin liquidating their short positions either with stops or market orders. Some reverse their position and go long.

The group which has still not entered the market — either because their orders to buy the market were never reached or because they had hesitated to see whether the market was actually moving higher — begins to "buy at the market."

Remember that even if a number of traders have not entered the market because of hesitation, their attitude is still bullish. And perhaps they are even kicking themselves for not getting in earlier. As for those who sold out previously-established long positions at a profit only to see the market move still higher, their attitude still favors the long side. They may also be among those who are looking to buy on any further dip.

So, with each dip the market should find the support of 1) traders with long positions who are adding to their positions; 2) traders who are short the market and want to buy back their shorts "if the market will only back down some"; and 3) new traders without a position in the market who want to get aboard what they consider a full-fledged bull market.

This rationale results in price action that features one prominent high after another and each prominent reactionary low is higher than the previous low. In a broad sense, it should appear as an upward series of waves of successively higher highs and higher lows.

But at some point the psychology again subtly shifts. The first group with long positions and fat profits is no longer willing to add to its positions. In fact they are looking for a place to "take profits." The second group of battered traders with short positions has finally been worn down to a nub of die-hard shorts who absolutely refuse to cover their short positions. They are no longer a supporting element, eagerly waiting to buy the market on dips.

The third group of those who never quite got aboard the up-move become unwilling to buy because they feel the greatest part of the upside move has been missed. They consider the risk on the downside too great when compared to the now-limited upside potential. In fact, they may be looking for a place to "short the market and ride it back down."

When the market demonstrates a noticeable lack of support on a dip that "carries too far to be bullish," this is the first signal of a reversal in psychology. The decline from point I to point J is the classic example of such a dip. This decline signals a new tone to the market. The support on dips becomes resistance on rallies, and a more two-sided market action develops. (Resistance is the opposite of support. Resistance on a chart is the price level where selling pressure is expected to stop advances and possibly turn prices lower.)

The downturn
Now the picture has changed. As the market begins to advance from point J to point K, traders with previously-established long positions take profits by selling out. Most of the hard-nosed traders with short positions have covered their shorts, so they add no significant new buying impetus to the market. In fact, having witnessed the recent long decline, they may be adding to their short positions.

If the rally back toward the contract highs fails to establish new highs, this failure is quickly noticed by professional traders as a signal the bull market has run its course. This is even more true if the rally carries only up to the approximate level of the rally top at point G.

If the open interest also declines during the rally from J to K, it is another sign it was not new buying that caused the rally but short covering.

As profit-taking and new short-selling forces the market to decline from point K, the next critical point is the reactionary low point at J. A major bear signal is flashed if the market penetrates this prominent low (support) following an abortive attempt to establish new contract highs.

In the vernacular of chartists, a head-and-shoulders reversal pattern has been completed. But rather than simply explaining away price patterns with names, it is important to understand how the psychology of the market action at different points causes the market to respond as it does. It also explains why certain points are quite significant.

In a bear market, the attitudes of the traders would be reversed. Each decline would find the bears more confident and prosperous and the bulls more depressed and threadbare. With the psychology diametrically opposite, the pattern completely reverses itself to form a series of lower highs and lower lows.

But at some point, the bears become unwilling to add to their previously-established short positions. Those who were already long the market and had refused to sell higher would eventually be reduced to a hard core of traders who had their jaws set and refused to sell out. Traders not in the market who were perhaps unsuccessfully attempting to short the market at higher levels will begin to find the long side of the market more attractive. The first rally that "carries too high to be bearish" signals another possible trend reversal.

With this basic understanding of market psychology through three phases of a market, a trader is better equipped to appreciate the significance of all technical price patterns. No one expects to establish short positions at the high or long positions at the low, but development of a feel for market psychology is the beginning of the quest for trades that even hindsight could not improve upon.

When you analyze charts, approach them with the idea that they reflect human ideas about prices that are the result and the struggle between supply and demand forces. Your attitude and ability to judge market psychology will determine your success at chart analysis. Unexpected occurrences can change price trends abruptly, and without warning. Also, some of the chart formations may be hard to visualize. You'll sometimes need a good imagination as well.

If you like the post, please subscribe to Bursa Chat. We will send you the latest post by Email
===> Click
Subscribe to Bursa Chat by Email


BACK TO CHAT BOX

Thursday, July 30, 2009

GDP Zenith?

Thursday, July 30, 2009 0 Comments

In a hypothetical scenario, if there was a big black bear out there, he would mark the zenith of the rally during these few days which would coincide with the release of the US GDP data (advanced estimates) tomorrow night.

Late last month, we called for this bullish wave which has pushed the KLCI up by 100 points to a peak of 1,179 yesterday. We believe that the main force driving this 2 week rally is the upcoming US GDP results, which experts think could surprise on the upside. With the US GDP results out tomorrow, we opine that this could possibly be a short term peak, and that traders should be more cautious in the next few days.

On Monday, we called for a correction towards the end of the week. This scenario is now coming into play with the KLCI down 7.9 points yesterday and the Dow mildly negative for the last two days. These are small symptoms of toppishness.

US Q2 GDP Results out tomorrow
The critical US GDP results advanced estimates for Q2 will be released tomorrow night. Consensus estimates peg an annualized GDP decline of 1.5%which is a significant improvement over the previous quarters annualized decline of 5.5%. We think that positivity of the GDP data has already been priced in with a 12% rise in the Dow and a 9.3% rise in the highly correlated FBM-KLCI in the last two weeks

Peak of Positivity
With a string of US economic reports (Case Shiller Housing Indexand Durable Goods ex-trans) showing positive results yet still failing to push the Dow above its 9,124 high in the last few days, it is obvious that US traders are now uncertain and awaiting the release of the GDP data tomorrow. We think that theGDP data might possibly be the short term finale of the recent bullish wave.

We still retain our bullish view, but opine that KLCI traders should now i) take profit at upticks and ii) suspend buying for now and observe the post-GDP behavior of the US Dow Jones. If the Dow and global markets can still rally post-GDP data then it could be a positive continuity sign for the global bull rally.


If you like the post, please subscribe to Bursa Chat. We will send you the latest post by Email
===> Click
Subscribe to Bursa Chat by Email


BACK TO CHAT BOX

Saturday, July 25, 2009

FIVE CHART PATTERNS

1.Profitable Pattern Number One
The Symmetrical Triangle: A Reliable Workhorse

You’ll recognize the symmetrical triangle pattern when you see a stock’s price vacillating up and down and converging towards a single point. Its back and forth oscillations will become smaller and smaller until the stock reaches a critical price, breaks out of the pattern, and moves drastically up or down.

The symmetrical triangle pattern is formed when investors are unsure of a stock’s value. Once the pattern is broken, investors jump on the bandwagon, shooting the stock price north or south.


Symmetrical Triangle Pattern

Symmetrical triangles are very reliable. You can profit from upwards or downwards breakouts. You’ll learn more about how to earn from downtrends when we talk about maximizing profits.
If you see a symmetrical triangle forming, watch it closely. The sooner you catch the breakout, the more money you stand to make.

Watch For:

• Sideways movement, a period of rest, before the breakout.• Price of the asset traveling between two converging trendlines.• Breakout ¾ of the way to the apex.

Set Your Target Price:
As with all patterns, knowing when to get out is as important as knowing when to get in. Your target price is the safest time to sell, even if it looks like the trend may be continuing.For symmetrical triangles, sell your stock at a target price of:
• Entry price plus the pattern’s height for an upward breakout.• Entry price minus the pattern’s height for a downward breakout.

2.Profitable Pattern Number Two

Ascending and Descending Triangles: The Traditional Bull and Bear

When you notice a stock has a series of increasing troughs and the price is unable to break through a price barrier, chances are you are witnessing the birth of an ascending triangle pattern.


Ascending Triangle Pattern


The descending triangle is the bearish counterpart to the ascending triangle.

The ascending and descending patterns indicate a stock is increasing or decreasing in demand. The stock meets a level of support or resistance (the horizontal trendline) several times before breaking out and continuing in the direction of the developing up or down pattern.
Sponsor:Instant delivery of explicit forex trade alerts sounds like something you might be interested in - try them FREE for 30 days!
How to Profit from Ascending and Descending Triangles
Ascending and descending triangles are short-term investor favorites, because the trends allow short-term traders to earn from the same sharp price increase that long-term investors have been waiting for. Rather than holding on to a stock for months or years before you finally see a big payday, you can buy and hold for only a period of days and reap in the same monster returns as the long-time stock owners.
As with many of our favorite patterns, when you learn to identify ascending and descending triangles, you can profit from upwards or downwards breakouts. That way, you’ll earn a healthy profit regardless of where the market is going.
Watch For:
• An ascending or descending pattern forming over three to four weeks.
Set Your Target Price:
For ascending and descending triangles, sell your stock at a target price of:
Entry price plus the pattern’s height for an upward breakout.• Entry price minus the pattern’s height for a downward breakout.

3.Profitable Pattern Number Three

Head and Shoulders: A ChartAdvisor Staple

The head and shoulders pattern is a prevailing pattern among short sellers, investors who profit from downtrends. After three peaks, the stock plummets, offering a textbook, high-return opportunity to traders who catch the trend early.


The first trough is a signal that buying demand is starting to weaken. Investors who believe the stock is undervalued respond with a buying frenzy, followed by a flood of selling when traders fear the stock has run too high. This decline is followed by another buying streak which fizzles out early. Finally, the stock declines to its true worth below the original price.

How to Profit from the Head and Shoulders Pattern
• Short sell as soon as the price moves below the neckline after the descent from the right shoulder.
Set Your Target Price:
For the head and shoulders pattern, buy shares at a target price of:
• Entry price minus the pattern’s height (distance from the top of the head to the neckline).

4&5Profitable Patterns Number Four and Five

Triple and Double Bottoms and Tops: Reversals upon reversals

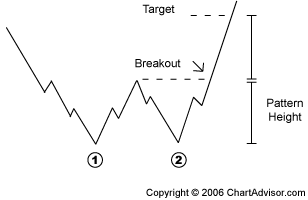
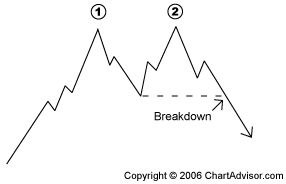
When you see a W or M pattern forming, you may have just discovered a money-making double bottom or double top pattern. These patterns are common reversal patterns used to suggest the current stock trend may be likely to shift.

But don’t panic if your double bottom or double top patterns do not develop as you had originally thought. You haven’t lost your chance for cash. If your W or M pattern reverses for a fourth time, you could now be working with the profitable triple bottom or triple top.

Double Bottom Pattern

Double Bottom Pattern
A small peak is surrounded by two equal troughs.

Purchase When:

• The price exceeds the middle-peak price.

Watch For:

• A price increase of 10% to 20% from the first trough to the middle peak.
• Two equal lows, not to differ by more than 3% or 4%.

Set Your Target Price:

For the double bottom pattern, sell your stock at a target price of:

• Entry price plus the pattern’s height (distance from the peak to the bottom of the lowest trough).


Double Top Pattern
Double Top Pattern
A small trough is surrounded by two equal peaks.

Short Sell When:

• The price drops below the middle-trough price.

Watch For:

• A price decrease of 10% to 20% from the first peak to the middle trough.
• Two equal highs, not to differ by more than 3% or 4%.

Set Your Target Price:

For the double top pattern, buy shares at a target price of:

• Entry price minus the pattern’s height (distance from the trough to the top of the highest peak).

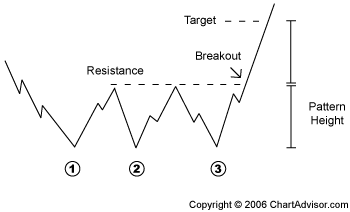
Triple Bottom Pattern

Triple Bottom Pattern
Three equal troughs amid a series of peaks.


Purchase When:

• The price exceeds the resistance established by the prior peaks.

Watch For:

• A series of three identical troughs at the end of a prolonged downtrend.

Set Your Target Price:

For triple bottom patterns, sell your stock at a target price of:

• Entry price plus the pattern’s height (distance from the resistance to the bottom of the lowest trough).

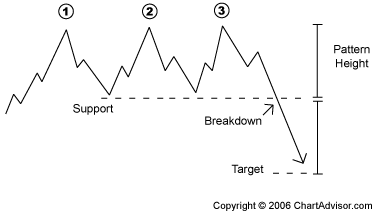
Triple Top Pattern

Triple Top Pattern
Three equal peaks amid a series of troughs.

Purchase When:

• The price falls below the support that formed from the prior troughs.

Watch For:

• A series of three peaks at relatively the same level.

Set Your Target Price:

For triple top patterns, buy shares at a target price of:

• Entry price minus the pattern’s height (distance from the support to the top of the highest peak).


Now You Know…

The five most profitable stock patterns:

• symmetrical triangle
• ascending and descending triangles
• head and shoulders
• double top and double bottom
• triple top and triple bottom

How to Minimize Your Risk

No investment advisor likes to admit it, but no stock picking system is perfect. Sometimes, the stocks we think will explode, don’t. Sometimes, the stocks we feature lose money.

There may not be a foolproof system to predicting the stock market, but we do have a foolproof system for managing risk. ChartAdvisor follows one of the safest risk reduction systems available.

Using these three simple steps, you can reduce the risk in your stock picking plan:

Three Ways to Take Risk Out of the Stock Market

1. Screen Your Picks. This might seem obvious, but patterns that look like they are developing into predictable trends do not always follow through. After combing over thousands of stock charts a day, ChartAdvisor will often not fetures a single stock.

2. Get In. Get Out. ChartAdvisor preaches setting realistic target exit prices for all stocks. We lock in high returns while the stock is high, and we get out before the market has a chance to change its mind.

3. Set Tight Stop Losses This step is absolutely critical to minimizing your risk in the stock market. If a sure-fire winner turns out to be a fizzled-out dud, your system needs to have a built-in, abandon-ship trigger. That is, you need to know when to cut your losses and move on to brighter prospects.


If you like the post, please subscribe to Bursa Chat. We will send you the latest post by Email
===> Click
Subscribe to Bursa Chat by Email


BACK TO CHAT BOX

Friday, July 24, 2009

KUALA LUMPUR: Bursa Malaysia has reduced the tick size, which is the minimum price variation between the buy and sell price for a stock, with effect from Aug 3.

The stock exchange operator said the tick size was reduced in line with the current practice by global developed markets and to create market depth, enable price discovery and boost liquidity in the local equities market.

Chief executive officer Datuk Yusli Mohamed Yusoff said investors relied on information such as tick sizes to estimate future movement of a counter's share price as well as form a gauge of market sentiment.

"We anticipate that this reduction of tick size will broaden participation from investors who are poised to provide more liquidity to the local market as investors can enter and exit the market more easily.

"In addition, the smaller tick size will enable investors and traders to take advantage of more trading opportunities with each price movement, however small it is," he said in a statement.

Yusli said this was more evident with the advent of electronic access or Direct Market Access infrastructure which operates efficiently with smaller tick sizes.

Under the revised tick structure, the minimum price change of listed securities would be reduced.

Currently, a RM5.10 stock is quoted in multiples of five sen which means that the next tick up is RM5.15 and the next tick down is RM5.05.

With the new tick sizes, investors can now quote in multiples of 1 sen which will now see a RM5.10 stock go up to the next tick which is RM5.11 or next tick down which is RM5.09.
Bursa Malaysia said this would create more trading opportunities for both buyer and seller.

The equity Exchange Traded Funds (ETFs) on the Main Board would also benefit from the change to a smaller tick size.

It added these ETFs had a tick size of one sen regardless of any price. Under the revised structure, any ETFs below RM1 will have a tick size of 0.1 sen and ETFs that are priced between RM1 and RM2.995 will have a tick size of 0.5 sen.

For ETFs that are priced at RM3.00 and above, the new tick size will be 1 sen. Meanwhile, the bond ETF maintains its extremely small tick size of 0.1 sen.

In respect to the bidding price for buying-in, the Exchange will retain the 10 ticks. Arising from this, the buying-in price will be based on the current tick sizes instead of the new tick sizes to ensure that the buying-in price is attractive to potential sellers.

If you like the post, please subscribe to Bursa Chat. We will send you the latest post by Email
===> Click
Subscribe to Bursa Chat by Email


BACK TO CHAT BOX

Wednesday, July 22, 2009

The US Dow Jones market has been impressively bullish the last one week when it recorded its 7 consecutive positive trading session last night. It is fully confirmed, the Dow is now in full bull mode.

Recent High Broken
The Dow Bull is now spreading its newfound proverbial wings withthe GMMA chart showing an upwards expansion of the shorter term trend lines above the longer term lines. This sign is indicative of the strong momentum of the bull. Thus, it was no surprise at all that the Dow broke through its critical high of 8,877.9. With the Dow closing marginally above the recent high at 8,915.9, it is now very critical for the Dow to stay above 8,877.9 and to break above the 9,000 psychological level in the next one week, lest it loses its momentum.

FBM-KLCI sideliners to jump in today
Since the KLCI’scorrelation with the Dow has now increased to 86%, expect the Dow’s break above its high last night to draw our local sideliners into the market today. Expect previously hesitant and non-believing sideliners to push the KLCI Team Coveragemarket up via its second liner counters such as property stocks.We maintain our bullish call on the FBM-KLCI as well as recommendations on our top property and construction trading picks such as DNP, E&O, FAJAR and FAJAR-WA.

News Highlights

Malaysia

Sime Darby Bhd (SIME MK, Buy, TP: RM7.70) says its current year's earnings will not match what it has achieved in the previous period, given the lower crude palm oil (CPO) prices but will remain within expectations. Group president and managing director Datuk Seri Ahmad Zubir Murshid said the lower performance is anticipated in all of its business divisions due to the global economic slowdown, but it will not be as bad as expected. "It will be within our expectations. Although crude palm oil prices have gone down, it would be offset by other divisions," Ahmad Zubir told reporters in Selangor yesterday. (BT)
* * * * *
Sime Darby Bhd (SIME MK, Buy, TP: RM7.70) is sending a team to China to conduct further studies on its proposed participation in the 700-sq km economic development zone (EDZ) near Weifang city. “The initial size that we are looking at is about 100-sq km but we don’t know the gross development value yet,” said its president and group chief executive Datuk Seri Ahmad Zubir Murshid. (Financial Daily)
* * * * *
HeidelbergCement AG is looking to sell its Malaysian assets for US$400m to US$500m. An information memorandum recently went out and bids were said to have come in from private equity sponsors and strategic investors, according to banking sources. Financial adviser Standard Chartered Bank is providing a staple financing for the debt portion of the deal. Meanwhile, Sunway Holdings Bhd (SGW MK, Hold, TP: RM1.09) is said to have placed its bid to acquire HeidelbergCement’s local concrete plants, quarries and asphalts, but might pull out after the indicative selling price was raised to US$250m. (Starbiz)
* * * * *
Proton Holdings Bhd recorded a slight improvement in sales in the first half of this year boosted by its newly launched multi purpose vehicle (MPV) Exora. Bookings for the MPV so far stand at 15,767 units, while 6,200 units have already been sold since it was launched in February this year. Proton is aiming to sell about 27,000 Exora units locally by end of this year. (The Malaysian Reserve)
* * * * *
Dialog Group Bhd has teamed up with Vopak Asia Pte Ltd, a member of the world’s largest independent tank terminal operator Royal Vopak Group (Vopak), to study the feasibility of developing an independent storage terminal for oil products in Pengerang, Johor. The total investment outlay of the proposed terminal had yet to be determined, pending results of the feasibility study. Subject to the feasibility study, the parties would enter into definitive agreements not later then Sept 30, 2010. The parties would then form a joint-venture company (JVC) here, in which Dialog would hold a 51% stake and Vopak 49%. The JVC will have an initial paid-up capital of RM1,000 comprising 1,000 ordinary share of RM1 each. (Financial Daily)
* * * * *
Bursa Malaysia Bhd aims to attract as many as 40 new listings a year as the easing of investment rules in the country helps draw foreign investors. Bursa attracted 23 listings last year and 26 in 2007.The benchmark FTSE Bursa Malaysia KLCI has risen up 30% this year, lagging behind regional markets. Bursa said more than 20 companies are already in the “pipeline” for initial share sales, with more expected following the easing of investment rules. (Financial Daily)
* * * * *
Axis Real Estate Investment Trust, which has just agreed to buy its first property this year, is in talks for another four buildings worth RM220m. They include logistic warehouses in Johor, Puchong and Petaling Jaya, said Stewart LaBrooy, chief executive officer of Axis REIT Managers Bhd, which manages the property trust. Axis REIT plans to sell the maximum number of new units it can to private investors for the acquisitions since its debt-to-assets ratio is already close to the 50% limit under the rules, leaving it little room to gear up further. A REIT is only allowed to sell up to a fifth of its current units according to Securities Commission rules, LaBrooy said, which means that it may be able to raise about RM75m from the private placement. (BT)
* * * * *

The federal government has restructured and taken over the management of the RM5bn Terengganu Investment Authority (TIA), which will now be known as 1Malaysia Development Bhd (1MDB). To kick start 1MDB, a sovereign wealth fund (SWF) from Abu Dhabi will invest US$1bn (RM3.45bn) to jointly carry out investments in the Malaysian energy, real estate and hospitality sectors. The features and structures of 1MDB are supposed to be the same as those of TIA except that it will invest not only in Terengganu but the whole of Malaysia. The principal shareholder of 1MDB is Minister of Finance Inc (MoF Inc) instead of Menteri Besar of Terengganu (MB Inc). (Financial Daily)
* * * * *
Malaysia’s consumer price index (CPI) is likely to have fallen in June from a year earlier by 1.35%. It is the first annual decline in two decades, although a period of deflation is expected to be short lived. The fall would compare with an annual rise in May 2.4% and would largely reflect a fall in oil prices from high year-earlier levels. A 30% hike in bus and taxi fares due in August will offset deflationary pressures as transportation costs make up 31.4% of the CPI basket. (Financial Daily)
* * * * *
The possibility of higher electricity rates will be discussed at the Cabinet meeting today and, if approved, will take effect next month, said Energy, Green Technology and Water Minister Datuk Peter Chin Fah Kui. However, he pointed out that any potential increase would not be “too drastic” so that it would not overly burden consumers. Electricity tariffs are expected to be raised in tandem with the upward revision in gas prices which Petronas supplies to the country’s power sector. It is speculated that gas price will be raised 4% to 5% followed by a corresponding upward revision in electricity tariffs. Chin said it would definitely be lower that what was speculated. (The Star)
* * * * *

Global


Stocks finished higher Tuesday with the Dow ending at a 6-month high after a volatile session in which investors weighed better-than-expected corporate earnings with Federal Reserve Chairman Ben Bernanke©s warning that the economic recovery would be slow. The Dow Jones industrial average gained 0.8% (+67.8 pts, close 8,915.9). The Nasdaq gained 0.4% (+6.9 pts, close 1,916.2) and the S&P 500 index gained 0.4% (+3.5 pts, close 954.6). In currency trading, the dollar gained against major currencies, including the euro, British pound and Japanese yen. U.S. light crude oil for August delivery rose 72 cents to settle at US$64.72 a barrel on the New York Mercantile Exchange. (CNNmoney)
* * * * *
Federal Reserve Chairman Ben S. Bernanke said while the economy is showing “tentative signs of stabilization,” the central bank intends to maintain a “highly accommodative” monetary policy for “an extended period.” “The pace of decline appears to have slowed significantly,” Bernanke said yesterday in semi-annual testimony before the House Financial Services Committee. At the same time, “in light of the substantial economic slack and limited inflation pressures, monetary policy remains focused on fostering economic recovery,” he said. Fed officials said in a report submitted as part of Bernanke’s testimony that policy will be “tightened” when the labour market improves, an economic recovery takes hold and pressures holding down inflation “diminish.” The comments follow a rally in stocks and a rebound in corporate earnings that have stoked speculation the worst recession in half a century is ending. (Bloomberg)
* * * * *
Regional Federal Reserve bank directors expressed concern that rising unemployment and loss of wealth from falling incomes and house prices posed a risk to recovery from the worst recession in at least half a century. The boards of directors of all 12 regional Fed banks voted to request leaving the so-called discount rate, or the rate on direct loans to commercial banks, unchanged at 0.5% in meetings before the Fed’s Open Market Committee gathering in June, the central bank said yesterday. “While pointing to signs of some stabilization in economic conditions, most notably the slowing pace of decline in GDP, and to modest improvements in financial markets, they generally considered economic activity to be weak and the financial system to remain somewhat fragile,” the Fed said in minutes of the Board of Governors’ discussions on the
discount rate. (Bloomberg)
* * * * *
Britain had a £13bn (US$21.4bn) budget deficit in June, the most for the month since records began in 1993, as the worst economic slump in a generation ravaged tax revenue and drove up jobless claims. The shortfall compared with £7.5bn a year earlier as tax income fell 5.7% and spending increased 2.8%, the Office for National Statistics said in London yesterday. The median of 13 forecasts in a Bloomberg News survey was £15.5bn. Prime Minister Gordon Brown risks putting pressure on the pound unless he commits to a “credible” plan to narrow the deficit once the recession is over, the International Monetary Fund warned last week. (Bloomberg)
* * * * *
Italian research institute Isae said the nation’s economy will contract 5.3% this year, twice as it previously forecast, according to written testimony presented to parliament in Rome yesterday. Italy’s economy, Europe’s fourth biggest, will expand 0.2% next year, compared with a February forecast of a 0.4% increase. Isae in February said the economy would shrink 2.6% this year. (Bloomberg)
* * * * *
Asia’s export-dependent nations may see their recoveries falter in 2H09 as overseas demand remains subdued, economists said. “Recovery in Asia does not look especially durable,” said Michael Taylor, a senior economist at Lombard Street Research Ltd. in London. “Sustainable Asian growth still depends on a global recovery lifting demand for exports.” Improvements in Asia’s economic performance in 2Q09 were largely due to “front-loaded” fiscal stimulus that cannot be sustained, Taylor said. The Organization for Economic Cooperation and Development expects the world’s most-industrialized nations, which buy the bulk of Asia’s exports, to shrink 4.1% this year and grow only 0.7% in 2010. “The shape of the recovery over the next 12 months will vary across the region,” said Kevin Grice, a senior international economist at Capital Economics Ltd. in London. “For the most trade-dependent economies, the recent spurt in growth will fade in the second half of the year as demand from the rest of the world remains weak.” (Bloomberg)
* * * * *
Most investors are shaking off the world economic crisis and many are willing to take on more risk as they hunt for opportunities, especially in China and India, according to a survey by Bloomberg News. The first Quarterly Bloomberg Global Poll of financial investors and analysts singled out stocks and commodities as offering the most promising returns over the next year. The survey shows scepticism about the recovery in the U.S. and Europe, with 44% of respondents saying Europe poses the greatest risk for investors and 20% citing the U.S. The poll was conducted between July 14 and 17 of investors and analysts on six continents. It’s based on interviews with a random sample of 1,076 Bloomberg subscribers, representing decision makers in markets, finance and economics. The poll has a margin of error of plus or minus 3 percentage points. (Bloomberg)
* * * * *


If you like the post, please subscribe to Bursa Chat. We will send you the latest post by Email
===> Click
Subscribe to Bursa Chat by Email


BACK TO CHAT BOX

Saturday, July 18, 2009

Price Volume Trend combines percentage price change and volume to confirm the strength of price trends or through divergences, warn of weak price moves. Unlike other price-volume indicators, the Price Volume Trend takes into consideration the percentage increase or decrease in price, rather than just simply adding or subtracting volume based on whether the current price is higher than the previous day's price. How the formula is calculated is presented below:

  1. On an up day, the volume is multiplied by the percentage price increase between the current close and the previous time-period's close. This value is then added to the previous day's Price Volume Trend value.
  2. On a down day, the volume is multiplied by the percentage price decrease between the current close and the previous time-period's close. This value is then added to the previous day's Price Volume Trend value.

The Price Volume Trend is helpful in seeing divergences; examples of these divergences are shown below in the chart of AT&T (T):

Price Volume Trend

The Price Volume Trend indicator is usually interpreted as follows:

* Increasing price accompanied by an increasing Price Volume Trend value, confirms the price trend upward.
* Decreasing price accompanied by a decreasing Price Volume Trend value, confirms the price trend downward.
* Increasing price accompanied by a decreasing or neutral Price Volume Trend value is a divergence and is indicating that the price movement upward is weak and lacking conviction.
* Decreasing price accompanied by a increasing or neutral Price Volume Trend value is a divergence and is indicating that the price movement downward is weak and lacking conviction.

High #1 to High #2

AT&T stock made lower highs, but the Price Volume Trend indicator made higher highs. This bullish divergence warned that bulls might be taking control of the stock and shorting AT&T would not be advisable.

Since the Price Volume Trend indicator multiplies positive volume when prices close higher than the previous day's close, the Price Volume Trend indicator could be interpreted as meaning that more volume flowed into High #2 than flowed into High #1. More volume interest by buyers at High #2 signaled that the price move higher had significant strength behind it and it probably was going to continue.

Low #1 to Low #2

The stock price made higher lows, generally considered a bullish signal; the Price Volume Trend indicator confirmed this move higher when it made higher highs as well.

Price Volume Trend is a valuable technical analysis tool that combines both price and volume to confirm price action or warn of potential weakness or lack of conviction by buyers and sellers.


If you like the post, please subscribe to Bursa Chat. We will send you the latest post by Email
===> Click
Subscribe to Bursa Chat by Email


BACK TO CHAT BOX

Trendlines in Forex Trading

7.1. What are Trendlines?

Trendlines are straight lines that connect each successive rising bottom to show an uptrend or each consecutive declining top to indicate a downtrend. There should be 2 price points for the trendline to be drawn. The longer the trendline and the more points it connects the stronger it can support/resist the prices on subsequent tests - because more market participants are aware of it. The steeper the trendline - the more bullish or bearish the market sentiment.

Ideal up trendline

Up-trendline

Ideal down trendline

Down-trendline

The up-trend trenline visible on the 1-day EUR/USD chart (from 29.09.05 to 07.09.2007) provided support to the prices

Click to Enlarge. Chart Source - ProCharts.

downtrendline-gbpusd

Click to Enlarge. Chart Source - ProCharts.

Note: All forex charting packages allow to draw the trendlines. Some of them (e.g. Intellichart) can also automatically create trendlines for you.

Most major currencies, like EUR/USD and NZD/USD which are shown below, are characterized by frequent, sustained and well-defined trends. Trendlines can be a very effective tool which you can use to follow and profit from these currency price movements.

trends -eurusd

Click to Enlarge. Chart Source - ProCharts.

trends nzdusd

Click to Enlarge. Chart Source - ProCharts.

7.2. How to Draw a Trendline?

To draw an up trendline simply connect 2 or more ascending lows. To draw a down trendline do the same with two or more descending highs. Extend the trendline to the right to see where the future support (for an up trendline) or resistance (for a down trendline) levels should be. When drawing a trendline try to connect as many price extremes as possible -peaks of the upper shadows for downtrends and the bottoms of the lower shadows for uptrends. It is also possible for a trendline to pass through candles' shadows or the edges of their real bodies as long as it connects the maximum number of bottoms in uptrends or tops in downtrends. A trendline which connects a maximum number of points will have greatest predictive power for the future price action because it most accurately reflects the underlying market sentiment. Whenever the sentiment changes the new trendline will have to be drawn or the older one redrawn.

Example of Drawing the Up Trendline

drawing up trendline

Click to Enlarge. Chart Source - ProCharts.

Example of Drawing the Down Trendline

drawing down trendline

Click to Enlarge. Chart Source - ProCharts.

Note: You can practice drawing trendlines using our interactive currency charts in the Analyze Forex section.

Quote: "Andrews used a trendline that he named the Multi-Pivot line. This is a trendline which runs through more than two pivots. This trendline does not have to run through the exact high or low of each pivot; it only needs to be close to each pivot. Andrews believed that the greater number of pivots through which a trendline runs, the more important the trendline is for finding future support and resistance levels and pivots.", Patrick Mikula in his book "The Best Trendline Methods of Alan Andrews and Five New Trendline Techniques".

7.3. Using Trendlines in Forex Trading.

There is usually more than one trend showing itself in the price action (e.g. a longer-term uptrend being corrected by a shorter-term downtrend). This often results in seemingly meaningless price picture which can be quickly clarified by drawing a few trendlines. Simply draw all the trendlines you can on 3 charts of different time-frame: 1) on a daily chart, using historical data of 1-3 years (for long-term trends); 2) on a 1-hour chart using historical data of 1-3 months (for medium-term trends); 3) on a 15-minute chart, using historical price data of 1-3 weeks (for the short-term trends). You will be amazed how often the prices will respect and "obediently" manoeuvre through the network of trendlines that you have drawn. At times you can feel almost sorry for the price which is constantly getting hit by the various boundaries it encounters. No wonder, when it finally "feels" that it can move feely it easily gets "too excited about the future". The following example demonstrates this principle in action:

trendlines clarify

Click to Enlarge. Chart Source - ProCharts.

Note: It is a good idea to determine which charts to draw the trendlines on and discipline yourself to check and update these charts continuously. You can specify which charts to review in your daily checklist.

Note: Most bank reports on forex (e.g. KBC's weekly technical report) use trendlines of varying length in their technical analysis.

Quote: "Trendlines reflect hidden market order ", Alan S. Farley in his book, "The Master Swing Trader: Tools and Techniques to Profit from Outstanding Short-Term Trading Opportunities".

Trendlines will reverse their roles if broken - in accordance with the principle that the support and resistance levels will assume opposite roles once violated. An up trendline will often act as resistance to the future price rallies after it is decisively broken. Likewise, a violated down trendline will usually provide support to subsequent price dips. You can take advantage of this rule by extending all of your trendlines (broken or not) as far to the right of your charts as possible, as is shown below.

role reversal

Click to Enlarge. Chart Source - ProCharts.

Trading strategy using the trendlines is pretty straightforward. Buy on dips toward the up trendline and sell when the prices bounce off the down trendline. You can also add to your position on each successful test. The idea is to stay with the trend (be it a short-term, a medium-term or a long-term trend) and the trendlines help you to do exactly this. As you look for entry levels, it pays to think more in terms of "zones around your trendline" than the "exact price touches" - since many investors will have slightly different trendline positions and, therefore, might not act simultaneously when the price approaches it. For this reason you should try not to use overly tight stop-losses when trading trendlines. When the trendline is decisively broken, you exit all your trade (s) -as is demonstrated in the example below. This exit strategy is similar to closing all your positions at the break of the baseline which confirms the completion of one whole impulse wave.

trading strategy

Click to Enlarge. Chart Source - ProCharts.

Note: Candlestick patterns can help you to quickly determine if the test was successful when the prices test a trendline.

You can also draw a price channel line, parallel to the original trendline so that it passes through the maximum number of price extremes opposite to it (tops of rallies for up trendlines/bottoms of declines for down trendlines) - and take some of your profits when the prices touch this line. The following pictures illustrates this stategy.

uptrend channel trading strategy

Click to Enlarge. Chart Source - FXtrek IntelliChart™ Copyright 2001-2007 FXtrek.com, Inc. Sign Up Now!.

downtrend trading strategy

Click to Enlarge. Chart Source - FXtrek IntelliChart™ Copyright 2001-2007 FXtrek.com, Inc. Sign Up Now!.

Note: Trading strategy using price channels is similar to entering at the start and exiting at the end of the impulse waves of a larger impulse wave.

Alternatively, you can book your profits when the currency prices hit some prominent support/resistance area - like a longer-term trendline, round number level or a fibonacci retracement level of the longer-term trend.

7.4. Mastering Trendlines.

The only way to master trendlines is to draw them continuously.
If you like the post, please subscribe to Bursa Chat. We will send you the latest post by Email
===> Click
Subscribe to Bursa Chat by Email


BACK TO CHAT BOX

Wednesday, July 15, 2009


The markets have been volatile and difficult to call for the last two weeks, but we faithfully declined to call for the bears for our local markets and instead held firm to our status quo bullish view of the KLCI. It appears that our perseverance might be rewarded by the bulls soon.

Yesterday, the KLCI rallied by a significant 15.9 pts after an equally significant overnight rally in the Dow provided some sparks to the KLCI. Now the KLCI is on the verge of breaking through the psychological 1,100 level with20 more pts to go.

If the KLCI can break out of the 1,028-1,095 trading box by breaking above the high/resistance of 1,095, its odds of breaching the psychological 1,100 mark would improve drastically. Based on the current momentum of the KLCI, we opine that the likelihood of the KLCI venturing beyond the 1,100 levelis considerably high.

We maintain our bullish view of the KLCI and reiterate our call to trade in property and construction counters like E&O, DNP and FAJAR which we have written about in our most recent reports.


News Highlights

Malaysia

SapuraCrest Petroleum Bhd (SCRES MK, Hold, TP: RM1.32) has teamed up with GE Oil & Gas (GEOG), a unit of US-based global industrial conglomerate General Electric (GE) to further expand and enhance its 7-year-old service centre for the regional oil and gas industry. The group had entered into an agreement with GEOG last month via its subsidiary Sapura Power Services Sdn Bhd, to further improve the centre’s capabilities. Under the deal, the service centre will use the most advanced service and repair technologies from GEOG to maintain, repair and refurbish heavy industrial gas turbines and its components. (NST)
* * * * *
Malaysia Airports Holdings Bhd (MAHB), which has been at loggerheads with AirAsia Bhd (AIRA MK, Buy, TP: RM1.90) over the timeline for the completion of the new low-cost carrier terminal (LCCT), said yesterday the terminal would be ready by 2011, dispelling any notions of a possible delay. AirAsia, on its part, said that if that was the case, it would stick to and may even accelerate its fleet expansion plans. “We are only contemplating the deferment for 2011, we have not confirmed. We may even accelerate the delivery of Airbus A320s if the LCCT is ready on time,” AirAsia group chief executive officer Datuk Seri Tony Fernandes said. (Financial Daily)
* * * * *
Bumiputra-Commerce Holdings Bhd’s (BCHB MK, Hold, TP: RM8.80) subsidiary CIMB Islamic Bank Bhd (CIMB) has extended a RM1.5bn loan to the National Higher Education Fund Corporation (PTPTN). CIMB was also PTPTN’s repayment agent, via its bank branches and online banking portal, in addition to being its agent for the opening of accounts and deposit-taking for the National Education Savings Scheme. Total repayments collected via CIMB amounted to RM232m which makes CIMB’s deposit taking for SSPN the highest among SSPN agents. (Financial Daily)
* * * * *
Kuala Lumpur Kepong (KLK) Bhd’s (KLK MK, Sell, TP: RM10.40) unit PT Steelindo Wahana Perkasa (SWP) is buying 95% of PT Bumi Makmur Sejahtera (BMS) for RM2.3m to further increase its oil palm plantation area in Indonesia. KLK expects the acquisition to be completed in 1Q10, subject to the fulfilment of all conditions stated in the sale and purchase agreement. (Financial Daily)
* * * * *
Malaysia Airlines Cargo Sdn Bhd (MASkargo), unit of Malaysia Airlines System Bhd (MAS MK, Sell, TP: RM2.00) sees a turnaround of its cargo volume in 2H10 in line with the recovery of global economic conditions. Its general manager of business development and sales (cargo), Mohd Yuus Idris, said the company saw a 28% contraction in cargo volume in 1H09 against the same period last year. He said that demand from its main market, China, fell by more than 30%. However, he stated that the group see some flattening at the bottom, though there is not really a jump yet. (The Malaysian Reserve)
* * * * *
Metal Dealers’ Association of Selangor and Kuala Lumpur (MDA) is calling on the government to delay the implementation of some of the measures under the recent steel policy review that are scheduled to come into force on August 1, such as the impending mandatory standard requirement and the need for certificate of approval (COA) for all imported steel products. MDA president Lim Sin Leong said importers of industrial steel products needed time to make arrangements with overseas steel manufacturers to comply with the new ruling. He also said that the decision to liberalise the steel sector was done without proper consultation with downstream players and could cost their members up to RM3,000 in extra cost for every 100 tonnes of imported steel products. (Financial Daily)
* * * * *
Malaysia is reviewing domestic laws and regulations to make them more investor friendly to woo foreign direct
investments (FDIs) and boost investor confidence. International Trade and Industry Minister Datuk Mustapa Mohamed said immigration policies would also be overhauled to facilitate the entry and temporary stay of expatriates and foreign professionals. He said that FDI remains crucial for Malaysia’s industrial development in view of its contribution, technology transfer, capital inflow, access to international markets and spin-offs generated. (The Malaysian Reserve)
* * * * *
The 20% toll rebate announced last Saturday will be for Touch ‘n Go and SmartTag users who clock 80 or more transactions a month. The rebate starts on September 1 and will be credited to the electronic cards. Rebates can be claimed at 136 Touch ‘n Go counters at selected highways either every month or every three months. The rebate is a temporary measure as EPU is to carry out a study to find a long-term solution to reduce the cost of highway travel. (NST)
* * * * *


Stocks gained Tuesday after a choppy session in which investors welcomed Goldman Sachs' better-than-expected results but showed caution ahead of all the quarterly reports due in the weeks ahead. The Dow Jones industrial average gained 0.3% (+27.8 pts, close 8,359.5). The Nasdaq gained 0.4% (+6.5 pts, close 1,799.7) and the S&P 500 index gained 0.5% (+4.8 pts, close 905.8). In currency trading, the dollar gained versus the euro and fell versus the yen. U.S. light crude oil for August delivery fell 17 cents to settle at US$59.52 a barrel on the New York Mercantile Exchange. (CNNmoney)
* * * * *
U.S. businesses cut inventories again in May, according to a report signalling firms are making slow progress toward reducing excess supply but that more work lies ahead adjusting to lower sales. Inventories fell more than expected, Commerce Department data yesterday showed. The 1.0% drop from the prior month to a seasonally adjusted US$1.368trn followed a revised 1.3% decrease in April. Originally, April inventories were seen down 1.1%. Economists surveyed by Dow Jones Newswires forecast a 0.8% decline in May inventories. Business sales dipped by 0.1% to US$966.1bn in May. Sales in April fell an unrevised 0.3%. (Dow Jones Newswires)
* * * * *
Surging gasoline costs spurred gains in U.S. retail sales and wholesale prices in June, while a drop in spending outside of auto dealers and service stations reinforced concern an economic recovery will be limited. Sales at retailers rose 0.6% from May, more than forecast and the biggest gain since January, Commerce Department figures showed yesterday in Washington. Excluding autos and gas, purchases dropped for a 4th consecutive month. The Labour Department’s producer-price index gained 1.8%, twice as much as anticipated. Yesterday’s figures indicate that consumer spending likely fell last quarter, with little momentum heading into the latter part of the year. Job losses and declining home values are weighing on households, leaving them with little appetite to spend more, other than on necessities. (Bloomberg)
* * * * *
Industrial production in the 16 countries that use the euro posted its first m-o-m rise in nine months in May, in one of the first signs that the economy could be on the road to recovery. According to figures released yesterday by the European Union's statistics agency Eurostat, industrial production rose by 0.5% from April - the first monthly increase since August 2008 and also the largest monthly increase since a 1% rise in April 2008. Production in May fell by 17.0% y-o-y. The annual drop was the smallest since January this year, Eurostat said. The report of a rise in the monthly measure of output, as well as a slowdown in the pace of the y-o-y slump, suggests that the recent improvements reported in the more timely purchasing managers manufacturing survey are now evident in the official indexes. In the 27 countries that are in the European Union, output rose 0.1% on the month and fell 15.9% on the year, Eurostat said. (Dow Jones Newswires)
* * * * *
German investor confidence unexpectedly fell in July, suggesting the recovery in Europe’s largest economy may take longer to materialize. The ZEW Centre for European Economic Research in Mannheim said its index of investor and analyst expectations, which aims to predict economic developments six months ahead, declined to 39.5 from 44.8 in June. Economists expected a gain to 47.8, the median of 36 forecasts in a Bloomberg News survey showed. European investor confidence fell for the first time in four months in July, according to an index published by Germany’s Sentix research institute last week. (Bloomberg)
* * * * *
Eastern Germany’s recession probably eased in 2Q09 - and the economy may grow in 2H09 - as companies benefit from economic stimulus, the Halle-based IWH institute forecast yesterday. Economic contraction in Germany’s six eastern states including Berlin may have been 1.1% q-o-q in 2Q09, the institute said. IWH Director Udo Ludwig said 3Q09 could return to growth of as much as 0.3%. “The crisis has been less severe in the eastern region compared with the western states,” Ludwig said. Eastern Germany, which has an unemployment rate about twice that of the west, accounts for as much as 11% of Germany’s gross national product. Unlike the export-orientated 10 western German states, companies in the eastern region focus their goods and services on supplying domestic demand and have benefited from economic stimulus programs, IWH’s forecasters said. (Bloomberg)
* * * * *

The U.K. inflation rate dropped in June below the Bank of England’s 2% target for the first time since September 2007 as the recession sapped price pressures in the economy. Consumer prices rose 1.8% y-o-y, compared with 2.2% in May, the Office for National Statistics said yesterday in London. The result matched the median forecast in a Bloomberg News survey of 35 economists. The retail price index measure of inflation fell 1.6%, the most since records began in 1948. Officials say the inflation target will guide their strategy as they fight the threat of deflation with a 125bn-pound (US$204bn) asset-purchase program. On the month, consumer prices rose 0.3%. The annual inflation rate dropped as the cost of food and non-alcoholic drinks fell, the statistics office said. The Bank of England’s Monetary Policy Committee currently predicts it may not return to the target by 2011. (Bloomberg)
* * * * *
The U.K. housing market improved last month as more London real-estate agents and surveyors said home values increased rather than fell for the first time in 20 months, the Royal Institution of Chartered Surveyors said. Across Britain, the number of respondents saying prices dropped exceeded those reporting gains by 18.1 percentage points, the highest reading since September 2007, RICS said in its monthly survey released yesterday in London. The two-year long collapse in prices may be starting to end as the U.K. starts to emerge from its deepest recession in a generation. A majority of surveyors now expect property prices to increase for the first time since May 2007, RICS said yesterday. The indexes for new sales and buyer interest rose to the highest since 1999, according to the report. (Bloomberg)
* * * * *

If you like the post, please subscribe to Bursa Chat. We will send you the latest post by Email
===> Click
Subscribe to Bursa Chat by Email


BACK TO CHAT BOX

Monday, July 13, 2009

The FBM-KLCI remains largely unchanged last week, shedding a marginal 0.47% for the week to close at 1,067.7 last Friday. Where will it go from here?

FBM-KLCI uncertain
Though the 1,065 support still held steady, our local FBM-KLCI market looks uncertain with several “doji”shaped candlestick patterns in the last few days. The bulls want to push the index higher, but are fearful of plunging commodities prices particularly Crude Palm Oil (CPO) prices.

Plantation Stocks key to FBM-KLCI direction
Looking forward, plantation stocks which form 18.6% of the FBM-KLCI will dictate where our local market goes from here. If CPO prices continue toweaken and drag the plantation index lower to break the important 5,200 support level, it could spell negative repercussions for our local market. If the 5,200 support holds, the bulls could very well still be in control of the steering wheel.

We maintain our status quo positive view on the KLCI but would be watching the plantation index closely to detect any possible negativity that might drag the FBM-KLCI down.
FAJAR (RM0.93)
FajarBaruBuilder Group Bhdis currently forming a technical platform and stabilizing at the RM0.90 support level. If it can breach its immediate resistance at the RM0.95 level, it could rally upwards to re-challenge the RM1.00 resistance level. S : 0.90 FAJAR is currently trading at a P/E ratio of 6.5x (Bloomberg). Its warrants, which is trading at RM0.43 with zero premium, could be a good trading proxy to ride any potential rally in its mother share.


Bursa Chat New Highlights

Malaysia

Tenaga Nasional Bhd (TNB) (TNB MK, Hold, TP: RM7.00) and Sarawak Energy Bhd (SEB) signed a share sale agreement with Sime Darby Energy Sdn Bhd (SDESB) in relation to their acquisition of 100% interest in Sime Darby Power Link Sdn Bhd (SDPLSB). The purchase consideration was RM15.6m plus an adjustment amount to cater for additional cash advances made by SDESB to SDPLSB being payment for consultants before the completion of the deal. TNB and SEB will each hold 50% of the issued and fully paid-up capital of SDPLSB, while it is also intended that the Minister of Finance Inc participate in the equity of SDPLSB at the appropriate juncture. (Starbiz)
* * * * *
CIMB Bank has issued 667m new shares to Bumiputra Commerce Holdings Bhd (BCHB) (BCHB MK, Hold, TP: RM8.80) to pay off debt. The new CIMB shares were issued to settle the coupon payments and principal on the RM667m irredeemable convertible unsecured loan stocks (ICULS) which are due and payable to BCHB, it said in a filing with the stock exchange. (BT)
* * * * *
Boustead Holdings Bhd’s (BOUS MK, Hold, TP: RM3.60) plan to raise some RM729.1m in a rights issue has been approved by the Securities Commission. In a filing to Bursa Malaysia on Friday, Boustead said it plans to issue 260.4m new shares at the ratio of two rights shares, at RM2.80 each, for every five ordinary shares held. (BT)
* * * * *
General Motors Corp’s (GM) joint-venture (JV) with DRB-Hicom Bhd through Hicom-Cheverolet Sdn Bhd is believed to be on the rocks and may be coming to an end soon. The partnership between the 2 companies has been shaky of late and both sides have set a deadline to resolve their issues by the end of this month. As a result of the breakdown in the partnership,
it is understood that GM is starting to look at the possibility of finding a new partner for its operations in Malaysia. (The Malaysia Reserve)
* * * * *
Lenstar Investments Ltd is now looking at the possibility of constructing a petroleum refinery and petrochemical complex in Malaysia with total investment of up to US$8bn. According to the United Kingdom based investment holding company’s managing director, Mohamad Munir Malik, the company will start conducting feasibility studies in Melaka and Perak, as is even looking at Sabah and Sarawak as possible locations for the facilities. “The refinery and petrochemical complex will cost around US$4bn each. Our commitment here shows that we have full confidence that Malaysia is the right location and has what it takes to be the hub for oil and gas industry in the Asean region,” he added. (Financial Daily)
* * * * *
The number of passengers travelling through the KL International Airport (KLIA) fell 0.5%to 2.32m in May compared with the same month in 2008 due to a decline in international passengers. International passenger traffic was down 0.8% to 1.51m, while domestic passengers dropped marginally from 811,289 to 810,927. Passenger traffic at all other airports operated by Malaysia Airports Holdings Bhd grew 3.4% to 1.74m, driven by domestic passengers which rose 5.6% to 1.5m. International passengers, however, dropped 9.3% to 223,135. Systemwide, overall passenger traffic in May grew 1.1% to 4.05m. (BT)
* * * * *
Good news for motorists plying the nation©s tolled roads. Prime Minister Datuk Seri Najib Razak said a 20% discount would be given to users of SmartTAG and Touch 'n Go cards who pay toll 80 times or more a month. He said the move was an interim solution pending the completion of a comprehensive study on toll rates. (NST)
* * * * *
Hotel occupancy rates in the country fell at annual rates of between 15% and 20% in 1H09 due to the economic crisis and compounded by the A(H1N1) pandemic. According to data from the Tourism Malaysia website, there were 3.78m visitors in 2Q09, down 32.8% from 5.62m a year earlier. The biggest drop was from the United Arab Emirates (UAE), falling 68.9% to 2,177 visitors from 6,998 a year earlier. There was also a sizeable decline of tourists from Asean countries, with tourist arrivals from Singapore posting a 29.2% decline to 2.02m from 2.85m, while visitors from Indonesia showed a 35.5% decline to 376,890 from 584,664. Despite the challenging period, hotels are cautiously hopeful of a recovery in 2H09 with festivities and events to make up for part of the decline in tourist arrivals, including those from emerging markets of India and China. (Financial Daily)
* * * * *

Global


Blue chips slipped Friday, after a profit warning from Chevron dragged on oil stocks, but the Nasdaq managed modest gains for the day at the end of a down week for Wall Street. The Dow Jones industrial average lost 0.45% (-36.7 pts, close 8,146.5). The Nasdaq gained 0.2% (+3.5 pts, close 1,756.0) and the S&P 500 index dropped 0.4% (-3.6 pts, close 879.1). In currency trading, the dollar gained against the euro and fell against the Japanese yen. U.S. light crude oil for August delivery fell 52 cents to settle at US$59.89 a barrel on the New York Mercantile Exchange. (CNNmoney)
* * * * *
Sentiment among U.S. consumers dropped in July after four months of gains as unemployment approached 10%. The Reuters/University of Michigan preliminary index of consumer sentiment fell by more than forecast to 64.6 from 70.8 in the prior month. Consumers in the survey said they are less likely to buy cars or appliances, suggesting that the recovery may be weaker than anticipated. “Until the employment picture clears up, we can’t anticipate persistent gains in consumer spending.” said Jonathan Basile, an economist at Credit Suisse Holdings Inc. (Bloomberg)
* * * * *
The U.S. trade deficit unexpectedly narrowed in May to the lowest level in almost a decade as exports jumped while imports of crude oil and auto parts declined. The gap between imports and exports decreased 9.8% to US$26bn, the smallest deficit since November 1999, from a revised US$28.8bn in April that was lower than previously estimated, the Commerce Department said today in Washington. Imports fell while exports rose the most since July 2008. (Bloomberg)
* * * * *
The U.S. economy will expand faster than previously forecast in the second half of this year and in 2010 as a revival in consumer spending signals an end to the recession, a Bloomberg News survey showed. The U.S. economy will expand faster than previously forecast in the second half of this year and in 2010 as a revival in consumer spending signals an end to the recession. Signs of stability in the housing market, improving consumer confidence and smaller declines in auto sales are reinforcing forecasts for gains in consumer purchases. While the recovery is likely to be tempered by job cuts and shrinking household wealth, most economists said a second stimulus package won’t be needed. (Bloomberg)
* * * * *
The United States financial crisis is expected to complete its cycle through the turmoil within a year, given its accelerated pace compared to the Japanese experience in 1997/98, holder of the Tun Ismail Ali Chair in monetary and financial economics Takatoshi Ito said. He said unlike in the US, where the crisis began in early 2007 and was now in the recovery process, Japan’s banking crisis lasted around 10 years. Speaking on the differences between the two crises, he also cited that the US had avoided nationalising its banks, compared to Japan. (Financial Daily)
* * * * *
China’s urban home prices rose for the first time in seven months, adding to evidence that record bank lending is driving a recovery in the world’s third-largest economy. Prices in 70 major Chinese cities gained 0.2% in June from a year earlier, the National Development and Reform Commission said. Home values increased 0.8% from May, the fourth straight monthly gain. The China Se Shang Property Index of 24 real-estate companies rose 1.6%, beating the 0.3% drop in the benchmark. Property sales rose 32% by floor space and 53% by value, according to the National Bureau of Statistics. New loans rose almost fivefold in June from a year earlier to 1.53trn yuan, according to preliminary calculations, the central bank said July 8. (Bloomberg)
* * * * *
China’s exports fell for an eighth month as the global recession cut demand, highlighting the economy’s dependence on stimulus spending to revive growth. Overseas sales slid 21.4% in June from a year earlier, the customs bureau said Friday, after a record 26.4% drop in May. Imports fell a less-than-estimated 13.2%, the smallest decline in eight months, signaling that the worst may almost be over for the nation’s trade. (Bloomberg)
* * * * *
China’s economy is showing positive signs although that doesn’t mean the country’s difficulties are over, Premier Wen Jiabao said. The impact of the international financial crisis hasn’t eased and the foundations for an economic rebound are not solid, he said. The government will stick to its pro-active fiscal policy and moderately loose monetary policy, he added. (Bloomberg)
* * * * *

Russia’s central bank cut its main interest rates for the fourth time in less than three months after the economy contracted 10.2% through May and government spending failed to reverse the decline. Bank Rossii cut the refinancing rate to 11% from 11.5% and the repurchase rate charged on central bank loans to 10% from 10.5% effective July 13. The bank cut rates for the first time since 2007 on April 24 and again on May 13 and June 5. The average rate in May for one-year loans for non- financial companies was 15.9%, the statement said. (Bloomberg)
* * * * *
The International Energy Agency predicts global oil demand will rebound next year, recovering from the fastest drop since the early 1980s as the world economy emerges from its slump. Worldwide consumption of crude oil will increase by 1.4m barrels a day, or 1.7%, to 85.2m barrels a day next year, the adviser said in its first monthly report to include a forecast for 2010. The growth will be concentrated in emerging economies outside the Organization for Economic Cooperation and Development. The International Monetary Fund, in a forecast before the IEA prepared its outlook, estimated that the world economy will expand by 2.5% in 2010. The IEA said its 2010 view may remain “broadly unchanged” once it includes the revised IMF forecast, whose changes mainly reflected developed economies, where crude use is less intense. (Bloomberg)
* * * * *
Singapore’s economy probably expanded for the first time in five quarters as a rebound in manufacturing helped the
Southeast Asian nation emerge from its worse recession since independence in 1965. Gross domestic product rose an annualized 13.4% last quarter from the previous three months, after shrinking 14.6% between January and March, according to the median estimate of 12 economists surveyed by Bloomberg News. The trade ministry will release the data at 8 a.m. tomorrow. Singapore’s industrial output climbed in the first two months last quarter, while the decline in the island’s exports narrowed in May amid gains in drug shipments. Manufacturing, which slid 26.1% in the three months ended March, accounts for about a quarter of the economy. (Bloomberg)
* * * * *


If you like the post, please subscribe to Bursa Chat. We will send you the latest post by Email
===> Click Subscribe to Bursa Chat by Email


BACK TO CHAT BOX